|
Download Data (XLS File) |
|
||||||||
|
||||||||
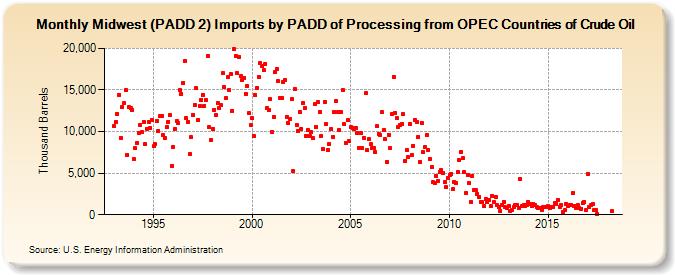
| Midwest (PADD 2) Imports by PADD of Processing from OPEC Countries of Crude Oil (Thousand Barrels) | ||||||||
| Year | Jan | Feb | Mar | Apr | May | Jun | Jul | Aug | Sep | Oct | Nov | Dec |
|---|---|---|---|---|---|---|---|---|---|---|---|---|
| 1993 | 10,610 | 11,115 | 12,169 | 14,444 | 9,227 | 12,952 | 13,380 | 14,994 | 7,215 | 12,924 | 12,780 | 12,628 |
| 1994 | 6,677 | 7,989 | 8,633 | 9,851 | 10,833 | 9,888 | 11,204 | 8,446 | 10,338 | 11,153 | 10,487 | 11,366 |
| 1995 | 8,212 | 8,458 | 11,237 | 10,080 | 11,824 | 11,871 | 9,548 | 9,222 | 10,510 | 11,192 | 11,961 | 5,888 |
| 1996 | 8,184 | 10,327 | 11,264 | 11,068 | 15,016 | 14,511 | 15,883 | 18,456 | 11,583 | 11,206 | 7,305 | 9,285 |
| 1997 | 12,021 | 13,205 | 15,203 | 11,428 | 13,057 | 13,831 | 14,452 | 13,124 | 13,795 | 19,118 | 10,488 | 9,032 |
| 1998 | 10,355 | 12,631 | 11,950 | 13,412 | 12,883 | 13,151 | 16,989 | 15,320 | 14,052 | 16,508 | 14,981 | 16,868 |
| 1999 | 12,511 | 19,918 | 19,144 | 17,007 | 18,979 | 16,629 | 16,215 | 16,477 | 14,556 | 15,481 | 12,173 | 10,779 |
| 2000 | 11,591 | 9,506 | 14,356 | 15,294 | 16,597 | 18,220 | 17,823 | 17,364 | 18,126 | 12,811 | 12,586 | 13,911 |
| 2001 | 9,948 | 11,764 | 17,122 | 17,526 | 16,020 | 14,078 | 14,045 | 15,910 | 16,190 | 11,778 | 11,012 | 11,554 |
| 2002 | 13,894 | 5,232 | 15,119 | 10,816 | 10,110 | 12,359 | 10,329 | 13,441 | 12,843 | 9,506 | 10,165 | 9,518 |
| 2003 | 9,891 | 9,165 | 13,275 | 10,599 | 13,541 | 12,389 | 9,489 | 7,925 | 13,598 | 10,888 | 7,840 | 8,520 |
| 2004 | 10,253 | 9,372 | 12,410 | 13,636 | 12,370 | 10,196 | 12,398 | 14,942 | 10,853 | 8,671 | 11,335 | 8,870 |
| 2005 | 10,493 | 10,425 | 10,254 | 10,384 | 9,815 | 8,051 | 9,806 | 8,000 | 9,264 | 14,606 | 7,723 | 9,068 |
| 2006 | 8,469 | 8,045 | 8,026 | 7,526 | 10,618 | 9,707 | 9,558 | 12,291 | 10,234 | 9,062 | 6,389 | 9,631 |
| 2007 | 7,983 | 12,129 | 16,568 | 12,275 | 11,635 | 10,604 | 10,728 | 10,923 | 12,053 | 6,505 | 7,780 | 6,897 |
| 2008 | 10,860 | 7,147 | 8,315 | 11,431 | 11,173 | 9,404 | 6,371 | 11,036 | 7,500 | 8,085 | 9,557 | 7,803 |
| 2009 | 6,729 | 5,730 | 3,893 | 3,759 | 4,631 | 4,110 | 5,147 | 5,359 | 5,029 | 3,898 | 3,319 | 4,435 |
| 2010 | 4,758 | 4,918 | 3,039 | 3,925 | 3,783 | 5,140 | 6,539 | 7,586 | 6,806 | 5,104 | 2,572 | 4,828 |
| 2011 | 3,787 | 1,511 | 4,699 | 2,975 | 2,936 | 2,538 | 2,102 | 1,588 | 1,476 | 992 | 1,921 | 1,484 |
| 2012 | 1,764 | 1,020 | 2,227 | 1,519 | 2,165 | 1,117 | 974 | 480 | 1,193 | 1,574 | 869 | 811 |
| 2013 | 1,019 | 402 | 548 | 957 | 1,164 | 1,179 | 805 | 4,294 | 1,083 | 1,171 | 1,039 | 1,180 |
| 2014 | 1,552 | 1,230 | 1,003 | 1,308 | 1,179 | 889 | 850 | 811 | 595 | 940 | 958 | 987 |
| 2015 | 989 | 861 | 962 | 960 | 1,401 | 1,327 | 1,806 | 949 | 1,131 | 319 | 515 | 1,337 |
| 2016 | 1,101 | 1,197 | 1,199 | 2,626 | 1,100 | 801 | 1,119 | 804 | 722 | 1,465 | 1,580 | 537 |
| 2017 | 4,942 | 878 | 1,120 | 1,264 | 522 | 543 | 134 | |||||
| 2018 | 400 | |||||||||||
| - = No Data Reported; -- = Not Applicable; NA = Not Available; W = Withheld to avoid disclosure of individual company data. |
| Release Date: 4/30/2024 |
| Next Release Date: 5/31/2024 |