|
Download Data (XLS File) |
|
||||||||
|
||||||||
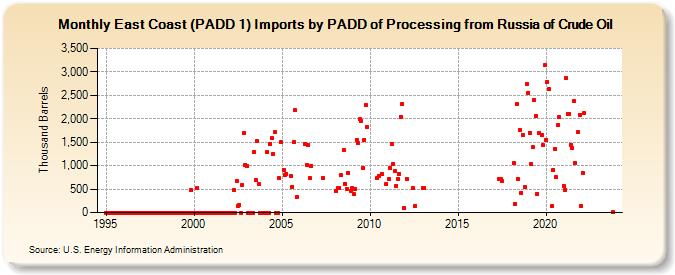
| East Coast (PADD 1) Imports by PADD of Processing from Russia of Crude Oil (Thousand Barrels) | ||||||||
| Year | Jan | Feb | Mar | Apr | May | Jun | Jul | Aug | Sep | Oct | Nov | Dec |
|---|---|---|---|---|---|---|---|---|---|---|---|---|
| 1995 | 0 | 0 | 0 | 0 | 0 | 0 | 0 | 0 | 0 | 0 | 0 | 0 |
| 1996 | 0 | 0 | 0 | 0 | 0 | 0 | 0 | 0 | 0 | 0 | 0 | 0 |
| 1997 | 0 | 0 | 0 | 0 | 0 | 0 | 0 | 0 | 0 | 0 | 0 | 0 |
| 1998 | 0 | 0 | 0 | 0 | 0 | 0 | 0 | 0 | 0 | 0 | 0 | 0 |
| 1999 | 0 | 0 | 0 | 0 | 0 | 0 | 0 | 0 | 0 | 0 | 474 | 0 |
| 2000 | 0 | 0 | 526 | 0 | 0 | 0 | 0 | 0 | 0 | 0 | 0 | 0 |
| 2001 | 0 | 0 | 0 | 0 | 0 | 0 | 0 | 0 | 0 | 0 | 0 | 0 |
| 2002 | 0 | 0 | 0 | 486 | 0 | 671 | 149 | 162 | 0 | 592 | 1,698 | 1,017 |
| 2003 | 991 | 0 | 0 | 0 | 0 | 1,293 | 684 | 1,518 | 599 | 0 | 0 | 0 |
| 2004 | 0 | 0 | 1,292 | 0 | 1,457 | 1,589 | 1,256 | 1,711 | 0 | 0 | 728 | 1,502 |
| 2005 | 897 | 800 | 830 | 787 | 555 | 1,494 | 2,178 | 327 | ||||
| 2006 | 1,458 | 1,009 | 1,443 | 727 | 993 | |||||||
| 2007 | 738 | |||||||||||
| 2008 | 457 | 513 | 524 | 791 | 1,334 | 618 | 511 | 852 | 454 | |||
| 2009 | 519 | 390 | 503 | 1,549 | 1,475 | 1,993 | 1,958 | 943 | 1,556 | 2,293 | 1,823 | |
| 2010 | 729 | 786 | 831 | 601 | ||||||||
| 2011 | 716 | 948 | 1,460 | 1,031 | 889 | 570 | 724 | 832 | 2,046 | 2,322 | 99 | |
| 2012 | 725 | 517 | 150 | |||||||||
| 2013 | 528 | 527 | ||||||||||
| 2017 | 720 | 721 | 669 | |||||||||
| 2018 | 1,053 | 190 | 2,308 | 720 | 1,770 | 425 | 1,662 | 536 | 2,736 | |||
| 2019 | 2,556 | 1,705 | 1,027 | 1,389 | 2,402 | 2,061 | 402 | 1,695 | 1,653 | 1,436 | 3,139 | |
| 2020 | 1,555 | 2,789 | 2,637 | 131 | 913 | 1,362 | 750 | 1,862 | 2,034 | |||
| 2021 | 569 | 487 | 2,873 | 2,111 | 2,107 | 1,450 | 1,381 | 2,368 | 1,053 | 1,708 | 2,087 | |
| 2022 | 138 | 848 | 2,112 | |||||||||
| 2023 | 10 | |||||||||||
| - = No Data Reported; -- = Not Applicable; NA = Not Available; W = Withheld to avoid disclosure of individual company data. |
| Release Date: 3/29/2024 |
| Next Release Date: 4/30/2024 |