|
Download Data (XLS File) |
|
||||||||
|
||||||||
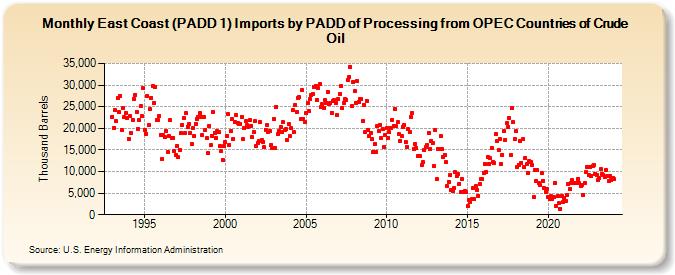
| East Coast (PADD 1) Imports by PADD of Processing from OPEC Countries of Crude Oil (Thousand Barrels) | ||||||||
| Year | Jan | Feb | Mar | Apr | May | Jun | Jul | Aug | Sep | Oct | Nov | Dec |
|---|---|---|---|---|---|---|---|---|---|---|---|---|
| 1993 | 22,710 | 20,165 | 24,276 | 21,600 | 27,047 | 23,681 | 27,485 | 19,715 | 24,692 | 22,530 | 23,484 | 22,328 |
| 1994 | 17,637 | 22,777 | 18,891 | 22,033 | 26,839 | 27,749 | 23,869 | 19,951 | 21,811 | 25,158 | 22,836 | 29,232 |
| 1995 | 19,704 | 18,750 | 27,555 | 20,684 | 24,351 | 27,019 | 29,714 | 25,925 | 29,463 | 21,904 | 21,885 | 22,809 |
| 1996 | 18,502 | 12,982 | 18,344 | 17,879 | 19,335 | 14,407 | 18,201 | 21,836 | 17,859 | 17,778 | 14,732 | 13,876 |
| 1997 | 15,928 | 13,249 | 15,042 | 18,830 | 20,720 | 22,486 | 19,005 | 23,466 | 20,371 | 20,945 | 18,977 | 16,284 |
| 1998 | 20,146 | 18,210 | 21,089 | 22,200 | 22,539 | 23,484 | 22,689 | 18,412 | 22,651 | 19,704 | 17,651 | 14,176 |
| 1999 | 20,601 | 16,069 | 18,179 | 23,778 | 18,948 | 17,650 | 19,280 | 19,195 | 15,863 | 14,647 | 12,717 | 15,804 |
| 2000 | 16,809 | 18,188 | 23,237 | 16,177 | 19,318 | 22,218 | 17,605 | 21,352 | 23,022 | 21,186 | 21,023 | 20,998 |
| 2001 | 22,686 | 17,430 | 20,032 | 21,608 | 20,711 | 20,382 | 21,855 | 20,612 | 17,892 | 19,163 | 21,679 | 16,018 |
| 2002 | 16,623 | 17,010 | 21,404 | 17,278 | 16,802 | 15,612 | 19,721 | 20,786 | 19,144 | 19,264 | 16,144 | 15,467 |
| 2003 | 22,189 | 15,330 | 24,984 | 18,620 | 19,463 | 20,208 | 19,121 | 21,369 | 19,556 | 19,779 | 17,257 | 20,967 |
| 2004 | 18,233 | 19,986 | 24,199 | 19,176 | 25,377 | 23,838 | 27,108 | 27,179 | 22,163 | 28,874 | 22,143 | 21,517 |
| 2005 | 23,430 | 25,840 | 23,998 | 26,738 | 27,686 | 27,965 | 29,550 | 29,804 | 26,638 | 29,291 | 30,194 | 24,849 |
| 2006 | 25,536 | 24,787 | 26,472 | 25,929 | 28,375 | 25,628 | 25,747 | 23,649 | 26,396 | 26,663 | 25,815 | 22,985 |
| 2007 | 26,779 | 27,973 | 29,767 | 24,719 | 25,959 | 26,692 | 26,637 | 31,067 | 31,881 | 34,198 | 25,201 | 30,793 |
| 2008 | 28,516 | 25,896 | 30,939 | 26,177 | 26,740 | 26,755 | 21,627 | 25,408 | 19,095 | 26,430 | 19,509 | 18,152 |
| 2009 | 18,978 | 17,488 | 14,474 | 16,315 | 14,598 | 20,583 | 19,318 | 20,770 | 17,796 | 19,868 | 15,767 | 18,465 |
| 2010 | 20,111 | 17,788 | 19,038 | 20,078 | 22,022 | 20,571 | 24,486 | 20,436 | 21,396 | 18,663 | 17,130 | 18,199 |
| 2011 | 20,393 | 20,711 | 16,884 | 15,752 | 19,792 | 19,106 | 22,653 | 23,544 | 15,235 | 16,376 | 15,476 | 13,578 |
| 2012 | 13,474 | 13,560 | 11,584 | 12,134 | 14,991 | 15,675 | 16,171 | 18,997 | 15,249 | 17,045 | 16,510 | 11,236 |
| 2013 | 19,506 | 8,224 | 15,217 | 15,237 | 18,251 | 15,186 | 13,347 | 13,775 | 12,102 | 6,534 | 7,659 | 9,131 |
| 2014 | 5,672 | 5,563 | 6,282 | 9,804 | 9,003 | 9,514 | 7,224 | 5,248 | 8,235 | 5,177 | 5,473 | 5,164 |
| 2015 | 1,961 | 3,439 | 3,013 | 3,622 | 6,121 | 3,561 | 6,573 | 5,820 | 4,416 | 7,083 | 8,327 | 8,215 |
| 2016 | 9,644 | 11,744 | 9,860 | 13,278 | 11,747 | 13,026 | 15,551 | 12,235 | 11,987 | 18,734 | 16,980 | 15,023 |
| 2017 | 17,572 | 11,721 | 13,883 | 19,352 | 17,315 | 21,119 | 20,199 | 22,422 | 13,805 | 24,695 | 21,396 | 17,417 |
| 2018 | 19,310 | 11,132 | 11,593 | 16,996 | 12,063 | 17,440 | 11,032 | 13,184 | 11,625 | 9,648 | 12,432 | 12,274 |
| 2019 | 11,489 | 4,147 | 10,329 | 7,871 | 10,281 | 7,361 | 6,780 | 9,694 | 7,852 | 6,116 | 5,330 | 5,949 |
| 2020 | 4,004 | 3,534 | 4,218 | 3,720 | 4,037 | 7,394 | 1,963 | 4,312 | 2,606 | 1,266 | 4,354 | 2,889 |
| 2021 | 3,907 | 3,242 | 4,522 | 7,022 | 5,932 | 7,409 | 7,943 | 7,315 | 7,368 | 7,256 | 8,330 | 7,335 |
| 2022 | 6,685 | 6,898 | 4,614 | 7,299 | 9,795 | 11,002 | 9,110 | 11,095 | 9,056 | 11,347 | 11,613 | 9,504 |
| 2023 | 9,268 | 8,144 | 8,582 | 10,510 | 9,494 | 9,218 | 8,613 | 10,398 | 9,061 | 7,771 | 8,912 | 8,090 |
| 2024 | 8,583 | |||||||||||
| - = No Data Reported; -- = Not Applicable; NA = Not Available; W = Withheld to avoid disclosure of individual company data. |
| Release Date: 3/29/2024 |
| Next Release Date: 4/30/2024 |