|
Download Data (XLS File) |
|
||||||||
|
||||||||
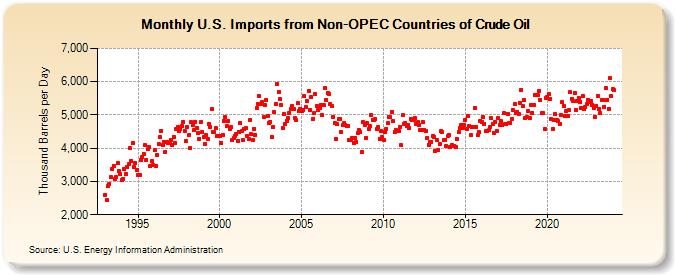
| U.S. Imports from Non-OPEC Countries of Crude Oil (Thousand Barrels per Day) | ||||||||
| Year | Jan | Feb | Mar | Apr | May | Jun | Jul | Aug | Sep | Oct | Nov | Dec |
|---|---|---|---|---|---|---|---|---|---|---|---|---|
| 1993 | 2,602 | 2,457 | 2,859 | 2,933 | 3,123 | 3,380 | 3,477 | 3,088 | 3,124 | 3,562 | 3,327 | 3,214 |
| 1994 | 3,053 | 3,077 | 3,366 | 3,227 | 3,427 | 3,520 | 3,996 | 3,627 | 4,143 | 3,444 | 3,545 | 3,352 |
| 1995 | 3,204 | 3,192 | 3,638 | 3,731 | 3,837 | 4,094 | 3,630 | 3,966 | 4,037 | 3,465 | 3,607 | 3,500 |
| 1996 | 3,932 | 3,479 | 3,788 | 4,125 | 4,332 | 4,526 | 4,082 | 4,177 | 3,891 | 4,196 | 4,145 | 4,142 |
| 1997 | 4,255 | 4,093 | 4,344 | 4,169 | 4,579 | 4,631 | 4,515 | 4,591 | 4,672 | 4,793 | 4,521 | 4,208 |
| 1998 | 4,636 | 4,388 | 3,998 | 4,780 | 4,709 | 4,533 | 4,791 | 4,607 | 4,443 | 4,291 | 4,779 | 4,484 |
| 1999 | 4,342 | 4,134 | 4,382 | 4,288 | 4,725 | 4,645 | 5,175 | 4,481 | 4,483 | 4,593 | 4,381 | 4,357 |
| 2000 | 4,355 | 4,159 | 4,411 | 4,808 | 4,935 | 4,672 | 4,821 | 4,591 | 4,625 | 4,248 | 4,301 | 4,376 |
| 2001 | 4,415 | 4,220 | 4,472 | 4,764 | 4,520 | 4,232 | 4,565 | 4,620 | 4,379 | 4,284 | 4,858 | 4,417 |
| 2002 | 4,244 | 4,588 | 4,405 | 5,193 | 5,337 | 5,561 | 5,316 | 5,378 | 4,926 | 5,311 | 5,448 | 4,968 |
| 2003 | 4,760 | 4,802 | 4,342 | 4,649 | 5,093 | 5,316 | 5,922 | 5,676 | 5,489 | 5,309 | 4,618 | 5,034 |
| 2004 | 4,737 | 4,819 | 4,907 | 5,065 | 5,180 | 5,270 | 5,166 | 4,910 | 4,837 | 5,344 | 5,114 | 5,186 |
| 2005 | 5,119 | 5,154 | 5,565 | 5,231 | 5,412 | 5,718 | 5,162 | 5,531 | 4,885 | 5,048 | 5,621 | 5,269 |
| 2006 | 5,143 | 5,198 | 5,289 | 5,004 | 5,293 | 5,811 | 5,463 | 5,653 | 5,634 | 5,322 | 5,254 | 4,947 |
| 2007 | 4,760 | 4,270 | 4,715 | 4,870 | 4,889 | 4,483 | 4,682 | 4,761 | 4,698 | 4,667 | 4,663 | 4,233 |
| 2008 | 4,246 | 4,319 | 4,162 | 4,319 | 4,180 | 4,458 | 4,544 | 4,499 | 3,897 | 4,774 | 4,701 | 4,320 |
| 2009 | 4,746 | 4,591 | 4,664 | 4,990 | 4,856 | 4,835 | 4,871 | 4,582 | 4,628 | 4,289 | 4,512 | 4,335 |
| 2010 | 4,241 | 4,473 | 4,584 | 4,755 | 4,944 | 4,930 | 5,098 | 4,816 | 4,484 | 4,553 | 4,517 | 4,516 |
| 2011 | 4,632 | 4,082 | 4,986 | 4,742 | 4,761 | 4,661 | 4,696 | 4,612 | 4,882 | 4,854 | 4,862 | 4,895 |
| 2012 | 4,714 | 4,774 | 4,704 | 4,546 | 4,544 | 4,778 | 4,552 | 4,523 | 4,318 | 4,110 | 4,199 | 4,193 |
| 2013 | 4,365 | 4,346 | 3,918 | 4,243 | 3,957 | 4,111 | 4,504 | 4,476 | 4,233 | 4,245 | 4,073 | 4,372 |
| 2014 | 4,392 | 4,031 | 4,094 | 4,069 | 4,059 | 4,031 | 4,272 | 4,479 | 4,596 | 4,690 | 4,618 | 4,709 |
| 2015 | 4,855 | 4,582 | 4,953 | 4,666 | 4,384 | 4,650 | 4,631 | 5,211 | 4,625 | 4,398 | 4,472 | 4,828 |
| 2016 | 4,799 | 4,935 | 4,741 | 4,521 | 4,505 | 4,536 | 4,628 | 4,898 | 4,726 | 4,460 | 4,781 | 4,525 |
| 2017 | 4,899 | 4,700 | 4,808 | 4,689 | 5,047 | 4,741 | 4,726 | 5,042 | 4,753 | 4,769 | 4,881 | 5,141 |
| 2018 | 5,323 | 5,066 | 5,097 | 5,018 | 5,368 | 5,757 | 5,266 | 5,438 | 4,920 | 4,943 | 5,107 | 4,914 |
| 2019 | 5,284 | 5,066 | 5,300 | 5,587 | 5,600 | 5,593 | 5,731 | 5,443 | 5,047 | 5,044 | 4,583 | 5,519 |
| 2020 | 5,538 | 5,621 | 5,489 | 4,879 | 4,576 | 4,844 | 5,025 | 4,850 | 4,815 | 4,725 | 4,997 | 5,376 |
| 2021 | 5,276 | 4,955 | 5,115 | 4,971 | 5,142 | 5,674 | 5,478 | 5,409 | 5,665 | 5,144 | 5,412 | 5,523 |
| 2022 | 5,401 | 5,214 | 5,555 | 5,169 | 5,249 | 5,319 | 5,456 | 5,399 | 5,408 | 5,312 | 5,198 | 4,939 |
| 2023 | 5,282 | 5,579 | 5,175 | 5,064 | 5,458 | 5,453 | 5,242 | 5,804 | 5,461 | 5,187 | 6,095 | 5,556 |
| 2024 | 5,768 | |||||||||||
| - = No Data Reported; -- = Not Applicable; NA = Not Available; W = Withheld to avoid disclosure of individual company data. |
| Release Date: 3/29/2024 |
| Next Release Date: 4/30/2024 |