|
Download Data (XLS File) |
|
||||||||
|
||||||||
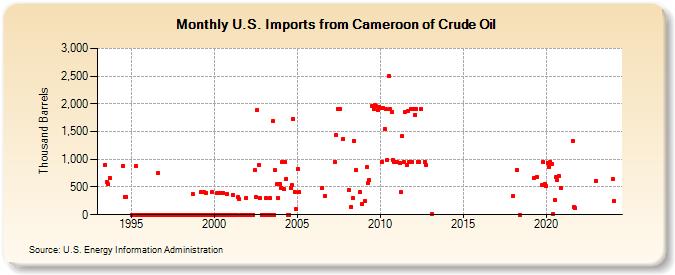
| U.S. Imports from Cameroon of Crude Oil (Thousand Barrels) | ||||||||
| Year | Jan | Feb | Mar | Apr | May | Jun | Jul | Aug | Sep | Oct | Nov | Dec |
|---|---|---|---|---|---|---|---|---|---|---|---|---|
| 1993 | 900 | 599 | 549 | 666 | ||||||||
| 1994 | 878 | 323 | 323 | |||||||||
| 1995 | 0 | 0 | 0 | 880 | 0 | 0 | 0 | 0 | 0 | 0 | 0 | 0 |
| 1996 | 0 | 0 | 0 | 0 | 0 | 0 | 0 | 748 | 0 | 0 | 0 | 0 |
| 1997 | 0 | 0 | 0 | 0 | 0 | 0 | 0 | 0 | 0 | 0 | 0 | 0 |
| 1998 | 0 | 0 | 0 | 0 | 0 | 0 | 0 | 0 | 376 | 0 | 0 | 0 |
| 1999 | 0 | 0 | 402 | 0 | 414 | 0 | 395 | 0 | 0 | 0 | 413 | 0 |
| 2000 | 0 | 0 | 383 | 0 | 400 | 0 | 398 | 0 | 0 | 377 | 0 | 0 |
| 2001 | 0 | 361 | 0 | 0 | 0 | 311 | 277 | 0 | 0 | 0 | 0 | 306 |
| 2002 | 0 | 0 | 0 | 0 | 0 | 799 | 315 | 1,886 | 900 | 298 | 0 | 0 |
| 2003 | 0 | 296 | 0 | 0 | 301 | 0 | 1,690 | 0 | 799 | 549 | 303 | 561 |
| 2004 | 488 | 947 | 467 | 950 | 649 | 0 | 0 | 484 | 529 | 1,730 | 417 | 95 |
| 2005 | 823 | 401 | ||||||||||
| 2006 | 487 | 343 | ||||||||||
| 2007 | 955 | 1,436 | 1,915 | 1,910 | 1,907 | 1,369 | ||||||
| 2008 | 439 | 146 | 301 | 1,337 | 800 | 403 | 200 | |||||
| 2009 | 250 | 858 | 567 | 619 | 1,962 | 1,906 | 1,982 | 1,953 | 1,887 | 1,945 | ||
| 2010 | 1,924 | 953 | 1,925 | 1,553 | 1,905 | 987 | 2,500 | 1,901 | 1,855 | 988 | 953 | 953 |
| 2011 | 954 | 931 | 404 | 1,418 | 953 | 1,859 | 903 | 1,879 | 954 | 1,909 | 954 | |
| 2012 | 1,906 | 1,805 | 1,906 | 955 | 954 | 1,911 | 954 | 905 | ||||
| 2013 | 10 | |||||||||||
| 2018 | 329 | 813 | 2 | |||||||||
| 2019 | 658 | 681 | 527 | 947 | 561 | |||||||
| 2020 | 516 | 928 | 867 | 956 | 915 | 17 | 269 | 674 | 629 | 699 | 488 | |
| 2021 | 1,335 | 140 | 125 | |||||||||
| 2023 | 617 | |||||||||||
| 2024 | 649 | |||||||||||
| - = No Data Reported; -- = Not Applicable; NA = Not Available; W = Withheld to avoid disclosure of individual company data. |
| Release Date: 3/29/2024 |
| Next Release Date: 4/30/2024 |