|
Download Data (XLS File) |
|
||||||||
|
||||||||
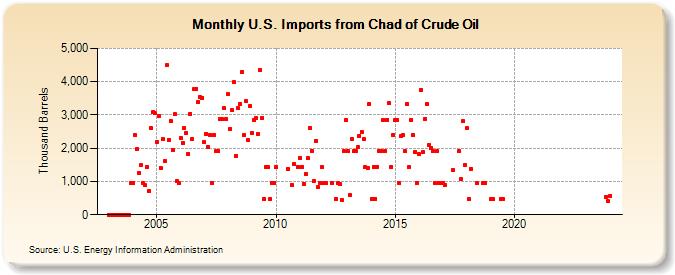
| U.S. Imports from Chad of Crude Oil (Thousand Barrels) | ||||||||
| Year | Jan | Feb | Mar | Apr | May | Jun | Jul | Aug | Sep | Oct | Nov | Dec |
|---|---|---|---|---|---|---|---|---|---|---|---|---|
| 2003 | 0 | 0 | 0 | 0 | 0 | 0 | 0 | 0 | 0 | 0 | 0 | 954 |
| 2004 | 941 | 2,398 | 1,962 | 1,263 | 1,485 | 958 | 892 | 1,449 | 724 | 2,601 | 3,078 | 3,054 |
| 2005 | 2,187 | 2,976 | 1,419 | 2,264 | 1,615 | 4,487 | 2,248 | 2,822 | 1,957 | 3,020 | 999 | 954 |
| 2006 | 2,301 | 2,162 | 2,605 | 2,469 | 1,837 | 3,031 | 2,263 | 3,770 | 3,789 | 3,386 | 3,527 | 3,521 |
| 2007 | 2,174 | 2,436 | 2,042 | 2,409 | 955 | 2,390 | 1,904 | 1,911 | 2,878 | 2,868 | 3,195 | 2,864 |
| 2008 | 3,617 | 2,584 | 3,143 | 3,989 | 1,779 | 3,200 | 3,336 | 4,299 | 2,385 | 3,406 | 2,238 | 3,263 |
| 2009 | 2,461 | 2,839 | 2,898 | 2,428 | 4,343 | 2,915 | 474 | 1,439 | 1,436 | 468 | 943 | 954 |
| 2010 | 1,430 | 1,387 | 906 | 1,522 | 1,449 | |||||||
| 2011 | 1,709 | 1,436 | 932 | 1,219 | 1,700 | 2,618 | 1,923 | 1,006 | 2,224 | 827 | 955 | 1,429 |
| 2012 | 952 | 952 | 950 | 467 | 942 | 931 | 453 | 1,905 | 2,858 | |||
| 2013 | 1,911 | 590 | 2,271 | 1,904 | 1,910 | 2,021 | 2,381 | 2,498 | 2,268 | 1,429 | 1,409 | 3,334 |
| 2014 | 477 | 1,422 | 483 | 1,443 | 1,919 | 1,908 | 2,848 | 1,907 | 2,856 | 3,345 | 1,430 | 2,389 |
| 2015 | 2,861 | 2,854 | 955 | 2,375 | 2,386 | 1,902 | 3,332 | 1,431 | 2,858 | 2,394 | 1,900 | 949 |
| 2016 | 1,815 | 3,758 | 1,875 | 2,881 | 3,315 | 2,096 | 1,995 | 1,904 | 949 | 1,901 | 947 | 951 |
| 2017 | 951 | 902 | 1,330 | 1,902 | 1,066 | 2,809 | 1,497 | |||||
| 2018 | 2,597 | 470 | 1,386 | 952 | 950 | 955 | ||||||
| 2019 | 477 | 472 | 476 | 476 | ||||||||
| 2023 | 543 | 403 | ||||||||||
| 2024 | 573 | |||||||||||
| - = No Data Reported; -- = Not Applicable; NA = Not Available; W = Withheld to avoid disclosure of individual company data. |
| Release Date: 3/29/2024 |
| Next Release Date: 4/30/2024 |
Referring Pages: