|
Download Data (XLS File) |
|
||||||||
|
||||||||
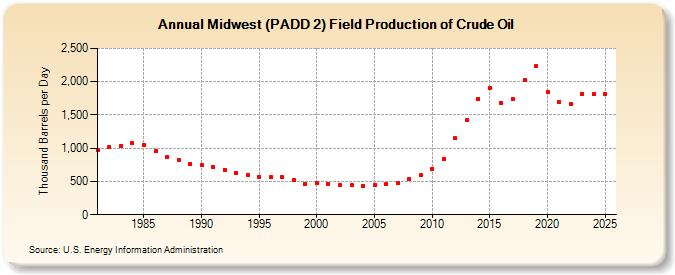
| Midwest (PADD 2) Field Production of Crude Oil (Thousand Barrels per Day) | ||||||||
| Decade | Year-0 | Year-1 | Year-2 | Year-3 | Year-4 | Year-5 | Year-6 | Year-7 | Year-8 | Year-9 |
|---|---|---|---|---|---|---|---|---|---|---|
| 1980's | 974 | 1,020 | 1,038 | 1,076 | 1,052 | 956 | 865 | 825 | 765 | |
| 1990's | 742 | 721 | 679 | 633 | 592 | 571 | 562 | 560 | 515 | 458 |
| 2000's | 475 | 458 | 448 | 441 | 438 | 440 | 464 | 475 | 544 | 590 |
| 2010's | 692 | 838 | 1,148 | 1,420 | 1,743 | 1,899 | 1,680 | 1,735 | 2,027 | 2,236 |
| 2020's | 1,848 | 1,694 | 1,661 | 1,824 |
| - = No Data Reported; -- = Not Applicable; NA = Not Available; W = Withheld to avoid disclosure of individual company data. |
| Release Date: 3/29/2024 |
| Next Release Date: 8/30/2024 |