|
Download Data (XLS File) |
|
||||||||
|
||||||||
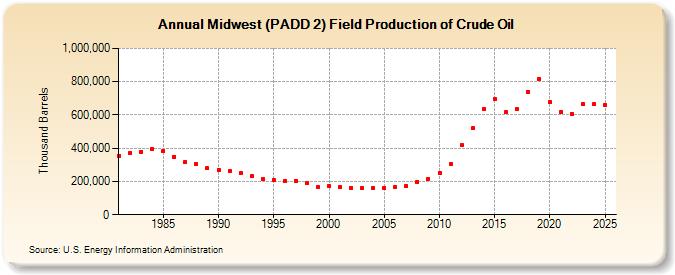
| Midwest (PADD 2) Field Production of Crude Oil (Thousand Barrels) | ||||||||
| Decade | Year-0 | Year-1 | Year-2 | Year-3 | Year-4 | Year-5 | Year-6 | Year-7 | Year-8 | Year-9 |
|---|---|---|---|---|---|---|---|---|---|---|
| 1980's | 355,653 | 372,436 | 378,879 | 393,759 | 384,082 | 348,814 | 315,661 | 301,994 | 279,117 | |
| 1990's | 270,657 | 263,286 | 248,565 | 230,927 | 216,110 | 208,333 | 205,620 | 204,363 | 187,838 | 167,295 |
| 2000's | 173,975 | 167,288 | 163,602 | 160,913 | 160,340 | 160,628 | 169,203 | 173,525 | 199,206 | 215,367 |
| 2010's | 252,735 | 305,716 | 420,281 | 518,394 | 636,259 | 693,179 | 614,985 | 633,431 | 740,026 | 816,284 |
| 2020's | 676,424 | 618,148 | 606,283 | 665,819 |
| - = No Data Reported; -- = Not Applicable; NA = Not Available; W = Withheld to avoid disclosure of individual company data. |
| Release Date: 3/29/2024 |
| Next Release Date: 8/30/2024 |