|
Download Data (XLS File) |
|
||||||||
|
||||||||
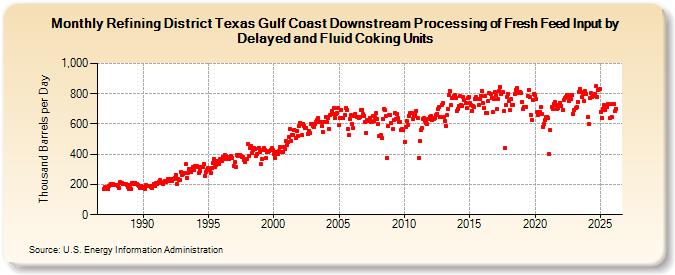
| Refining District Texas Gulf Coast Downstream Processing of Fresh Feed Input by Delayed and Fluid Coking Units (Thousand Barrels per Day) | ||||||||
| Year | Jan | Feb | Mar | Apr | May | Jun | Jul | Aug | Sep | Oct | Nov | Dec |
|---|---|---|---|---|---|---|---|---|---|---|---|---|
| 1987 | 171 | 182 | 170 | 167 | 168 | 191 | 194 | 204 | 201 | 199 | 196 | 195 |
| 1988 | 197 | 190 | 177 | 214 | 210 | 209 | 203 | 206 | 205 | 199 | 181 | 170 |
| 1989 | 199 | 168 | 211 | 209 | 205 | 212 | 200 | 199 | 189 | 179 | 187 | 174 |
| 1990 | 186 | 180 | 172 | 195 | 187 | 192 | 193 | 180 | 177 | 187 | 205 | 187 |
| 1991 | 207 | 200 | 208 | 218 | 229 | 211 | 203 | 216 | 223 | 215 | 224 | 237 |
| 1992 | 225 | 227 | 233 | 224 | 239 | 246 | 265 | 203 | 237 | 230 | 228 | 280 |
| 1993 | 265 | 268 | 277 | 333 | 245 | 278 | 305 | 302 | 281 | 294 | 314 | 297 |
| 1994 | 320 | 320 | 315 | 273 | 289 | 313 | 313 | 318 | 333 | 257 | 285 | 294 |
| 1995 | 307 | 298 | 276 | 309 | 344 | 371 | 318 | 332 | 353 | 346 | 333 | 370 |
| 1996 | 352 | 383 | 366 | 393 | 385 | 380 | 369 | 369 | 382 | 387 | 375 | 323 |
| 1997 | 346 | 314 | 396 | 387 | 394 | 394 | 391 | 381 | 379 | 360 | 346 | 369 |
| 1998 | 465 | 389 | 440 | 453 | 411 | 428 | 440 | 433 | 391 | 401 | 444 | 417 |
| 1999 | 334 | 367 | 430 | 439 | 428 | 376 | 414 | 412 | 421 | 430 | 440 | 427 |
| 2000 | 401 | 373 | 417 | 414 | 399 | 424 | 448 | 416 | 416 | 445 | 435 | 487 |
| 2001 | 462 | 478 | 517 | 567 | 489 | 529 | 529 | 563 | 507 | 552 | 523 | 587 |
| 2002 | 607 | 601 | 525 | 600 | 587 | 572 | 572 | 535 | 554 | 542 | 600 | 601 |
| 2003 | 585 | 581 | 599 | 612 | 628 | 640 | 614 | 612 | 584 | 546 | 612 | 616 |
| 2004 | 648 | 611 | 637 | 569 | 658 | 686 | 668 | 706 | 639 | 669 | 674 | 703 |
| 2005 | 593 | 638 | 695 | 637 | 637 | 657 | 704 | 691 | 566 | 527 | 631 | 657 |
| 2006 | 603 | 571 | 652 | 668 | 649 | 649 | 642 | 645 | 691 | 691 | 666 | 651 |
| 2007 | 616 | 541 | 624 | 617 | 641 | 616 | 613 | 651 | 617 | 643 | 672 | 632 |
| 2008 | 601 | 519 | 525 | 506 | 633 | 701 | 694 | 653 | 374 | 584 | 658 | 659 |
| 2009 | 607 | 565 | 625 | 674 | 636 | 663 | 638 | 616 | 615 | 563 | 564 | 559 |
| 2010 | 483 | 579 | 617 | 595 | 653 | 670 | 674 | 670 | 632 | 656 | 661 | 687 |
| 2011 | 637 | 376 | 487 | 560 | 573 | 634 | 641 | 617 | 609 | 601 | 630 | 646 |
| 2012 | 651 | 629 | 639 | 633 | 637 | 659 | 668 | 702 | 712 | 647 | 725 | 736 |
| 2013 | 643 | 622 | 588 | 657 | 702 | 791 | 818 | 723 | 771 | 784 | 789 | 769 |
| 2014 | 687 | 701 | 722 | 784 | 728 | 722 | 778 | 758 | 738 | 703 | 769 | 781 |
| 2015 | 737 | 725 | 686 | 722 | 711 | 766 | 777 | 764 | 725 | 762 | 788 | 818 |
| 2016 | 738 | 707 | 784 | 673 | 672 | 755 | 806 | 798 | 775 | 676 | 762 | 810 |
| 2017 | 791 | 699 | 763 | 819 | 846 | 797 | 812 | 684 | 439 | 723 | 779 | 800 |
| 2018 | 751 | 694 | 765 | 727 | 728 | 799 | 826 | 837 | 813 | 808 | 814 | 804 |
| 2019 | 747 | 699 | 712 | 711 | 713 | 785 | 827 | 778 | 662 | 627 | 759 | 801 |
| 2020 | 790 | 765 | 680 | 658 | 682 | 710 | 664 | 582 | 602 | 628 | 643 | 649 |
| 2021 | 640 | 401 | 560 | 713 | 702 | 734 | 744 | 726 | 702 | 708 | 722 | 740 |
| 2022 | 718 | 691 | 756 | 769 | 779 | 789 | 789 | 752 | 772 | 762 | 789 | 669 |
| 2023 | 694 | 705 | 711 | 748 | 814 | 833 | 809 | 776 | 800 | 753 | 815 | 800 |
| 2024 | 646 | |||||||||||
| - = No Data Reported; -- = Not Applicable; NA = Not Available; W = Withheld to avoid disclosure of individual company data. |
| Release Date: 3/29/2024 |
| Next Release Date: 4/30/2024 |