|
Download Data (XLS File) |
|
||||||||
|
||||||||
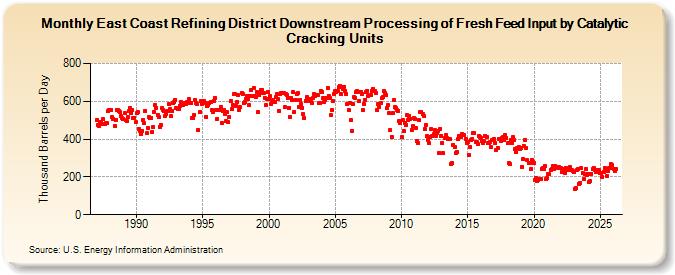
| East Coast Refining District Downstream Processing of Fresh Feed Input by Catalytic Cracking Units (Thousand Barrels per Day) | ||||||||
| Year | Jan | Feb | Mar | Apr | May | Jun | Jul | Aug | Sep | Oct | Nov | Dec |
|---|---|---|---|---|---|---|---|---|---|---|---|---|
| 1987 | 503 | 477 | 468 | 488 | 488 | 480 | 504 | 481 | 486 | 483 | 548 | 556 |
| 1988 | 553 | 554 | 516 | 508 | 470 | 501 | 556 | 552 | 549 | 541 | 520 | 509 |
| 1989 | 507 | 539 | 502 | 498 | 516 | 546 | 565 | 538 | 555 | 513 | 513 | 488 |
| 1990 | 536 | 544 | 455 | 445 | 426 | 444 | 500 | 483 | 550 | 430 | 459 | 515 |
| 1991 | 509 | 514 | 438 | 465 | 545 | 580 | 566 | 527 | 516 | 464 | 476 | 563 |
| 1992 | 554 | 547 | 523 | 534 | 550 | 584 | 559 | 520 | 550 | 593 | 595 | 609 |
| 1993 | 565 | 560 | 557 | 577 | 594 | 587 | 580 | 585 | 590 | 586 | 596 | 612 |
| 1994 | 592 | 590 | 512 | 511 | 528 | 607 | 593 | 586 | 449 | 542 | 601 | 585 |
| 1995 | 601 | 599 | 591 | 518 | 575 | 580 | 589 | 596 | 553 | 542 | 603 | 619 |
| 1996 | 554 | 508 | 554 | 554 | 572 | 485 | 551 | 556 | 532 | 495 | 543 | 489 |
| 1997 | 519 | 601 | 557 | 582 | 636 | 637 | 576 | 598 | 633 | 556 | 568 | 645 |
| 1998 | 638 | 591 | 596 | 613 | 628 | 613 | 580 | 630 | 659 | 629 | 671 | 630 |
| 1999 | 621 | 650 | 543 | 634 | 646 | 659 | 660 | 642 | 619 | 579 | 613 | 650 |
| 2000 | 611 | 626 | 584 | 596 | 605 | 597 | 621 | 638 | 613 | 550 | 636 | 645 |
| 2001 | 644 | 643 | 568 | 638 | 635 | 615 | 567 | 518 | 618 | 609 | 649 | 545 |
| 2002 | 609 | 639 | 642 | 572 | 606 | 584 | 566 | 532 | 511 | 601 | 621 | 605 |
| 2003 | 612 | 603 | 612 | 590 | 618 | 641 | 630 | 635 | 633 | 590 | 591 | 655 |
| 2004 | 648 | 618 | 596 | 605 | 616 | 672 | 630 | 617 | 526 | 555 | 600 | 638 |
| 2005 | 653 | 649 | 656 | 673 | 682 | 637 | 677 | 667 | 677 | 657 | 639 | 584 |
| 2006 | 556 | 590 | 500 | 445 | 585 | 623 | 618 | 647 | 654 | 600 | 650 | 650 |
| 2007 | 640 | 553 | 587 | 606 | 649 | 657 | 627 | 633 | 633 | 655 | 667 | 657 |
| 2008 | 653 | 644 | 554 | 584 | 570 | 589 | 616 | 625 | 652 | 644 | 631 | 567 |
| 2009 | 579 | 536 | 448 | 412 | 538 | 605 | 568 | 563 | 553 | 551 | 497 | 485 |
| 2010 | 410 | 499 | 443 | 484 | 476 | 527 | 503 | 521 | 508 | 447 | 467 | 511 |
| 2011 | 508 | 459 | 389 | 380 | 499 | 545 | 543 | 531 | 521 | 452 | 474 | 415 |
| 2012 | 396 | 378 | 412 | 454 | 416 | 428 | 447 | 419 | 431 | 443 | 328 | 455 |
| 2013 | 418 | 380 | 325 | 404 | 420 | 407 | 403 | 398 | 400 | 270 | 272 | 369 |
| 2014 | 357 | 326 | 334 | 398 | 414 | 419 | 413 | 427 | 423 | 421 | 403 | 382 |
| 2015 | 383 | 315 | 358 | 396 | 399 | 431 | 431 | 386 | 385 | 372 | 417 | 410 |
| 2016 | 406 | 391 | 380 | 388 | 418 | 409 | 377 | 377 | 385 | 359 | 394 | 394 |
| 2017 | 402 | 380 | 342 | 355 | 400 | 403 | 391 | 404 | 410 | 394 | 422 | 407 |
| 2018 | 378 | 273 | 267 | 396 | 378 | 410 | 395 | 346 | 331 | 353 | 357 | 349 |
| 2019 | 351 | 255 | 293 | 361 | 397 | 354 | 288 | 271 | 273 | 240 | 290 | 281 |
| 2020 | 274 | 184 | 196 | 180 | 186 | 189 | 188 | 242 | 248 | 243 | 259 | 189 |
| 2021 | 193 | 213 | 213 | 238 | 242 | 258 | 244 | 258 | 253 | 249 | 248 | 250 |
| 2022 | 245 | 227 | 225 | 242 | 219 | 249 | 235 | 235 | 236 | 250 | 239 | 232 |
| 2023 | 225 | 238 | 141 | 238 | 241 | 165 | 169 | 247 | 221 | 189 | 213 | 241 |
| 2024 | 239 | |||||||||||
| - = No Data Reported; -- = Not Applicable; NA = Not Available; W = Withheld to avoid disclosure of individual company data. |
| Release Date: 3/29/2024 |
| Next Release Date: 4/30/2024 |