|
Download Data (XLS File) |
|
||||||||
|
||||||||
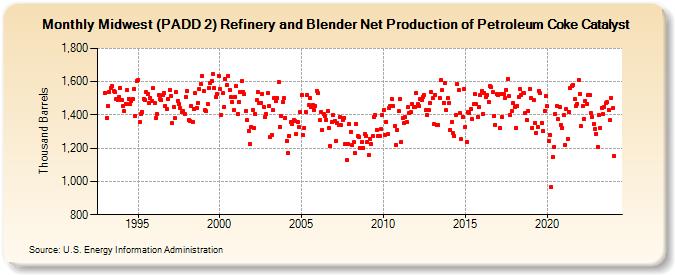
| Midwest (PADD 2) Refinery and Blender Net Production of Petroleum Coke Catalyst (Thousand Barrels) | ||||||||
| Year | Jan | Feb | Mar | Apr | May | Jun | Jul | Aug | Sep | Oct | Nov | Dec |
|---|---|---|---|---|---|---|---|---|---|---|---|---|
| 1993 | 1,534 | 1,379 | 1,454 | 1,536 | 1,560 | 1,574 | 1,544 | 1,537 | 1,495 | 1,489 | 1,508 | 1,562 |
| 1994 | 1,488 | 1,451 | 1,422 | 1,468 | 1,547 | 1,496 | 1,466 | 1,483 | 1,495 | 1,558 | 1,396 | 1,606 |
| 1995 | 1,612 | 1,355 | 1,403 | 1,420 | 1,497 | 1,487 | 1,536 | 1,527 | 1,471 | 1,504 | 1,486 | 1,559 |
| 1996 | 1,474 | 1,379 | 1,408 | 1,522 | 1,496 | 1,490 | 1,520 | 1,534 | 1,454 | 1,434 | 1,494 | 1,552 |
| 1997 | 1,516 | 1,349 | 1,449 | 1,380 | 1,536 | 1,484 | 1,463 | 1,440 | 1,416 | 1,424 | 1,407 | 1,510 |
| 1998 | 1,543 | 1,372 | 1,365 | 1,453 | 1,358 | 1,435 | 1,530 | 1,444 | 1,473 | 1,558 | 1,584 | 1,635 |
| 1999 | 1,544 | 1,429 | 1,421 | 1,464 | 1,562 | 1,594 | 1,605 | 1,646 | 1,561 | 1,507 | 1,524 | 1,637 |
| 2000 | 1,555 | 1,402 | 1,530 | 1,449 | 1,613 | 1,577 | 1,636 | 1,551 | 1,506 | 1,478 | 1,427 | 1,510 |
| 2001 | 1,575 | 1,408 | 1,480 | 1,535 | 1,603 | 1,536 | 1,524 | 1,425 | 1,368 | 1,302 | 1,227 | 1,327 |
| 2002 | 1,427 | 1,320 | 1,406 | 1,488 | 1,535 | 1,471 | 1,473 | 1,528 | 1,448 | 1,386 | 1,405 | 1,529 |
| 2003 | 1,452 | 1,266 | 1,280 | 1,428 | 1,502 | 1,486 | 1,499 | 1,595 | 1,329 | 1,394 | 1,476 | 1,500 |
| 2004 | 1,384 | 1,246 | 1,171 | 1,275 | 1,359 | 1,345 | 1,371 | 1,362 | 1,287 | 1,356 | 1,326 | 1,416 |
| 2005 | 1,517 | 1,277 | 1,322 | 1,419 | 1,520 | 1,459 | 1,499 | 1,446 | 1,460 | 1,430 | 1,455 | 1,545 |
| 2006 | 1,529 | 1,367 | 1,416 | 1,311 | 1,403 | 1,395 | 1,372 | 1,425 | 1,319 | 1,211 | 1,356 | 1,398 |
| 2007 | 1,362 | 1,243 | 1,354 | 1,339 | 1,387 | 1,338 | 1,370 | 1,384 | 1,224 | 1,129 | 1,225 | 1,346 |
| 2008 | 1,299 | 1,221 | 1,235 | 1,169 | 1,346 | 1,271 | 1,266 | 1,201 | 1,238 | 1,203 | 1,284 | 1,272 |
| 2009 | 1,235 | 1,159 | 1,257 | 1,224 | 1,272 | 1,389 | 1,398 | 1,312 | 1,274 | 1,276 | 1,313 | 1,398 |
| 2010 | 1,429 | 1,279 | 1,360 | 1,283 | 1,440 | 1,454 | 1,496 | 1,454 | 1,331 | 1,220 | 1,312 | 1,422 |
| 2011 | 1,495 | 1,236 | 1,380 | 1,350 | 1,386 | 1,357 | 1,445 | 1,409 | 1,415 | 1,465 | 1,447 | 1,449 |
| 2012 | 1,531 | 1,464 | 1,455 | 1,497 | 1,491 | 1,508 | 1,521 | 1,428 | 1,401 | 1,429 | 1,471 | 1,535 |
| 2013 | 1,500 | 1,344 | 1,520 | 1,338 | 1,340 | 1,501 | 1,607 | 1,547 | 1,474 | 1,589 | 1,427 | 1,500 |
| 2014 | 1,472 | 1,310 | 1,356 | 1,291 | 1,271 | 1,399 | 1,583 | 1,549 | 1,410 | 1,253 | 1,390 | 1,555 |
| 2015 | 1,330 | 1,240 | 1,416 | 1,412 | 1,435 | 1,373 | 1,465 | 1,523 | 1,464 | 1,388 | 1,447 | 1,518 |
| 2016 | 1,546 | 1,406 | 1,532 | 1,507 | 1,520 | 1,478 | 1,571 | 1,566 | 1,537 | 1,395 | 1,341 | 1,523 |
| 2017 | 1,517 | 1,320 | 1,527 | 1,388 | 1,525 | 1,501 | 1,552 | 1,616 | 1,516 | 1,400 | 1,421 | 1,470 |
| 2018 | 1,448 | 1,324 | 1,455 | 1,508 | 1,556 | 1,521 | 1,531 | 1,530 | 1,411 | 1,369 | 1,424 | 1,557 |
| 2019 | 1,501 | 1,322 | 1,487 | 1,354 | 1,291 | 1,329 | 1,544 | 1,530 | 1,354 | 1,305 | 1,424 | 1,511 |
| 2020 | 1,452 | 1,246 | 1,281 | 964 | 1,147 | 1,208 | 1,405 | 1,453 | 1,373 | 1,449 | 1,342 | 1,322 |
| 2021 | 1,398 | 1,221 | 1,434 | 1,257 | 1,418 | 1,561 | 1,576 | 1,582 | 1,494 | 1,454 | 1,468 | 1,611 |
| 2022 | 1,526 | 1,333 | 1,451 | 1,376 | 1,483 | 1,467 | 1,517 | 1,518 | 1,410 | 1,387 | 1,345 | 1,316 |
| 2023 | 1,287 | 1,209 | 1,398 | 1,324 | 1,444 | 1,407 | 1,450 | 1,469 | 1,476 | 1,432 | 1,369 | 1,504 |
| 2024 | 1,440 | |||||||||||
| - = No Data Reported; -- = Not Applicable; NA = Not Available; W = Withheld to avoid disclosure of individual company data. |
| Release Date: 3/29/2024 |
| Next Release Date: 4/30/2024 |