|
Download Data (XLS File) |
|
||||||||
|
||||||||
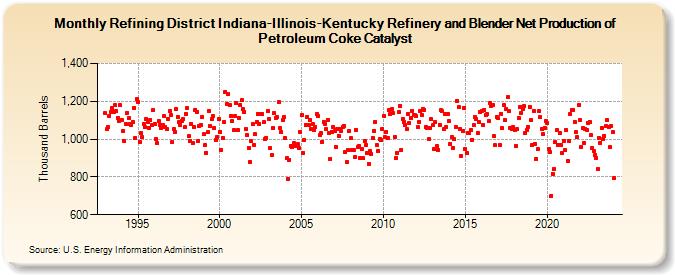
| Refining District Indiana-Illinois-Kentucky Refinery and Blender Net Production of Petroleum Coke Catalyst (Thousand Barrels) | ||||||||
| Year | Jan | Feb | Mar | Apr | May | Jun | Jul | Aug | Sep | Oct | Nov | Dec |
|---|---|---|---|---|---|---|---|---|---|---|---|---|
| 1993 | 1,136 | 1,051 | 1,063 | 1,123 | 1,144 | 1,164 | 1,144 | 1,181 | 1,148 | 1,113 | 1,098 | 1,180 |
| 1994 | 1,101 | 1,043 | 988 | 1,082 | 1,140 | 1,111 | 1,081 | 1,077 | 1,092 | 1,167 | 1,006 | 1,213 |
| 1995 | 1,195 | 987 | 1,030 | 1,011 | 1,080 | 1,063 | 1,106 | 1,092 | 1,060 | 1,102 | 1,074 | 1,153 |
| 1996 | 1,082 | 1,003 | 978 | 1,098 | 1,075 | 1,060 | 1,077 | 1,120 | 1,064 | 1,053 | 1,108 | 1,147 |
| 1997 | 1,128 | 983 | 1,053 | 1,040 | 1,161 | 1,118 | 1,090 | 1,076 | 1,097 | 1,105 | 1,063 | 1,135 |
| 1998 | 1,163 | 1,016 | 990 | 1,082 | 977 | 1,063 | 1,155 | 1,145 | 992 | 1,071 | 1,075 | 1,118 |
| 1999 | 1,025 | 968 | 929 | 1,035 | 1,149 | 1,068 | 1,104 | 1,121 | 1,058 | 996 | 1,013 | 1,106 |
| 2000 | 1,038 | 944 | 1,007 | 1,090 | 1,251 | 1,187 | 1,236 | 1,179 | 1,123 | 1,096 | 1,046 | 1,120 |
| 2001 | 1,190 | 1,048 | 1,112 | 1,180 | 1,205 | 1,157 | 1,143 | 1,053 | 1,021 | 954 | 881 | 988 |
| 2002 | 1,079 | 971 | 1,025 | 1,093 | 1,134 | 1,080 | 1,133 | 1,135 | 1,088 | 1,003 | 1,008 | 1,148 |
| 2003 | 1,106 | 951 | 915 | 1,059 | 1,137 | 1,112 | 1,116 | 1,196 | 1,059 | 1,037 | 1,101 | 1,116 |
| 2004 | 1,005 | 898 | 790 | 891 | 964 | 956 | 978 | 970 | 962 | 972 | 953 | 1,035 |
| 2005 | 1,128 | 928 | 995 | 1,072 | 1,119 | 1,073 | 1,102 | 1,056 | 1,082 | 1,046 | 1,065 | 1,131 |
| 2006 | 1,121 | 1,022 | 1,030 | 985 | 1,091 | 1,081 | 1,052 | 1,103 | 1,033 | 897 | 1,037 | 1,063 |
| 2007 | 1,044 | 959 | 1,051 | 1,019 | 1,054 | 1,041 | 1,065 | 1,071 | 930 | 877 | 943 | 1,043 |
| 2008 | 1,004 | 943 | 942 | 904 | 1,050 | 957 | 965 | 902 | 947 | 898 | 990 | 969 |
| 2009 | 926 | 870 | 935 | 922 | 1,007 | 1,045 | 1,092 | 968 | 937 | 1,000 | 993 | 1,051 |
| 2010 | 1,123 | 1,009 | 1,040 | 1,004 | 1,153 | 1,131 | 1,160 | 1,137 | 1,010 | 900 | 929 | 1,144 |
| 2011 | 1,177 | 943 | 1,105 | 1,093 | 1,073 | 1,051 | 1,133 | 1,085 | 1,114 | 1,151 | 1,129 | 1,125 |
| 2012 | 1,120 | 1,062 | 1,092 | 1,146 | 1,129 | 1,161 | 1,156 | 1,063 | 1,057 | 999 | 1,058 | 1,105 |
| 2013 | 1,072 | 950 | 1,090 | 962 | 944 | 1,076 | 1,152 | 1,147 | 1,053 | 1,133 | 1,064 | 1,131 |
| 2014 | 1,094 | 974 | 1,010 | 955 | 999 | 1,065 | 1,204 | 1,171 | 1,055 | 912 | 1,045 | 1,166 |
| 2015 | 948 | 925 | 1,034 | 1,031 | 1,047 | 997 | 1,074 | 1,116 | 1,107 | 1,031 | 1,088 | 1,145 |
| 2016 | 1,147 | 1,075 | 1,155 | 1,128 | 1,132 | 1,096 | 1,191 | 1,176 | 1,182 | 1,014 | 967 | 1,119 |
| 2017 | 1,110 | 969 | 1,135 | 1,058 | 1,180 | 1,100 | 1,159 | 1,224 | 1,146 | 1,060 | 1,053 | 1,065 |
| 2018 | 1,049 | 963 | 1,051 | 1,112 | 1,171 | 1,140 | 1,159 | 1,173 | 1,031 | 1,047 | 1,064 | 1,171 |
| 2019 | 1,101 | 970 | 1,150 | 975 | 897 | 945 | 1,146 | 1,117 | 1,054 | 1,025 | 1,061 | 1,097 |
| 2020 | 1,085 | 950 | 930 | 699 | 817 | 841 | 983 | 1,047 | 970 | 1,030 | 971 | 926 |
| 2021 | 988 | 940 | 1,048 | 884 | 988 | 1,131 | 1,152 | 1,156 | 1,091 | 1,036 | 1,009 | 1,179 |
| 2022 | 1,100 | 956 | 1,058 | 981 | 1,054 | 1,049 | 1,085 | 1,092 | 1,021 | 953 | 935 | 914 |
| 2023 | 901 | 842 | 1,008 | 982 | 1,060 | 999 | 1,017 | 1,067 | 1,101 | 1,064 | 958 | 1,070 |
| 2024 | 1,036 | |||||||||||
| - = No Data Reported; -- = Not Applicable; NA = Not Available; W = Withheld to avoid disclosure of individual company data. |
| Release Date: 3/29/2024 |
| Next Release Date: 4/30/2024 |