|
Download Data (XLS File) |
|
||||||||
|
||||||||
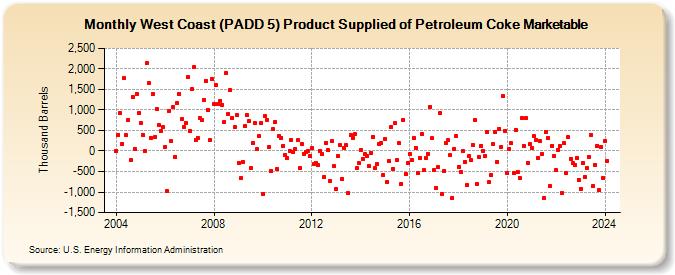
| West Coast (PADD 5) Product Supplied of Petroleum Coke Marketable (Thousand Barrels) | ||||||||
| Year | Jan | Feb | Mar | Apr | May | Jun | Jul | Aug | Sep | Oct | Nov | Dec |
|---|---|---|---|---|---|---|---|---|---|---|---|---|
| 2004 | 0 | 397 | 922 | 179 | 1,767 | 379 | 750 | -221 | 1,316 | 57 | 1,400 | 925 |
| 2005 | 692 | 390 | 1 | 2,133 | 1,664 | 323 | 1,391 | 342 | 1,014 | 624 | 490 | 574 |
| 2006 | 98 | -979 | 984 | 233 | 1,071 | -146 | 1,164 | 1,384 | 774 | 581 | 677 | 1,798 |
| 2007 | 484 | 1,506 | 2,036 | 274 | 318 | 805 | 746 | 1,248 | 1,712 | 1,002 | 270 | 1,752 |
| 2008 | 1,143 | 1,601 | 1,152 | 1,229 | 1,127 | 712 | 1,897 | 901 | 1,484 | 804 | 576 | 874 |
| 2009 | -284 | -660 | -266 | 599 | 876 | 730 | -423 | 200 | 674 | 40 | 355 | 678 |
| 2010 | -1,039 | 847 | 760 | 96 | -487 | 531 | 714 | -439 | 361 | 324 | 129 | -100 |
| 2011 | -180 | -1 | 267 | -33 | 45 | 261 | -420 | 181 | -64 | -15 | 5 | -125 |
| 2012 | 68 | -320 | -281 | -339 | 0 | -70 | -622 | 207 | 16 | -729 | 237 | -377 |
| 2013 | -926 | -116 | 146 | -677 | 84 | 139 | -1,025 | 387 | 326 | 414 | -426 | -282 |
| 2014 | 27 | -192 | -82 | -126 | -369 | -46 | 350 | -418 | -324 | 170 | 190 | -583 |
| 2015 | 296 | -751 | -253 | 590 | -430 | 673 | -222 | 185 | -794 | 757 | -559 | -303 |
| 2016 | -71 | -224 | 312 | 82 | -537 | -163 | 418 | -464 | -170 | -61 | 1,082 | 306 |
| 2017 | -463 | -894 | -400 | 917 | -1,039 | -481 | 189 | 256 | -108 | -1,138 | 51 | 354 |
| 2018 | -389 | -503 | -7 | -257 | -837 | -132 | -222 | 154 | 764 | -796 | -144 | 129 |
| 2019 | 1 | -119 | 452 | -767 | -590 | 168 | 473 | -260 | 547 | 94 | 1,331 | 496 |
| 2020 | -541 | 45 | 187 | -540 | 520 | -514 | -651 | 798 | 121 | 807 | -288 | 160 |
| 2021 | 81 | 364 | 262 | -159 | 236 | -70 | -1,144 | 475 | 326 | -857 | 129 | -118 |
| 2022 | -473 | 35 | 122 | -1,018 | 188 | -539 | 331 | -187 | -297 | -333 | -167 | -698 |
| 2023 | -917 | -292 | -631 | -419 | -139 | 399 | -853 | -331 | 133 | -960 | 106 | -661 |
| 2024 | 254 | |||||||||||
| - = No Data Reported; -- = Not Applicable; NA = Not Available; W = Withheld to avoid disclosure of individual company data. |
| Release Date: 3/29/2024 |
| Next Release Date: 4/30/2024 |