|
Download Data (XLS File) |
|
||||||||
|
||||||||
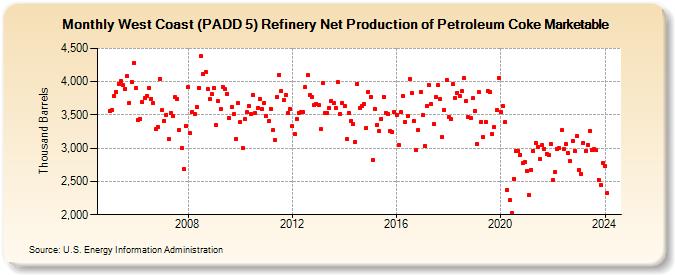
| West Coast (PADD 5) Refinery Net Production of Petroleum Coke Marketable (Thousand Barrels) | ||||||||
| Year | Jan | Feb | Mar | Apr | May | Jun | Jul | Aug | Sep | Oct | Nov | Dec |
|---|---|---|---|---|---|---|---|---|---|---|---|---|
| 2005 | 3,564 | 3,569 | 3,785 | 3,843 | 3,972 | 4,006 | 3,943 | 3,893 | 4,078 | 3,683 | 3,995 | 4,285 |
| 2006 | 3,907 | 3,423 | 3,446 | 3,692 | 3,752 | 3,787 | 3,909 | 3,745 | 3,675 | 3,285 | 3,318 | 4,042 |
| 2007 | 3,569 | 3,415 | 3,500 | 3,136 | 3,530 | 3,486 | 3,764 | 3,740 | 3,272 | 3,009 | 2,681 | 3,330 |
| 2008 | 3,918 | 3,223 | 3,539 | 3,511 | 3,623 | 3,909 | 4,384 | 4,112 | 4,147 | 3,885 | 3,738 | 3,812 |
| 2009 | 3,907 | 3,342 | 3,707 | 3,582 | 3,926 | 3,884 | 3,819 | 3,452 | 3,612 | 3,509 | 3,144 | 3,676 |
| 2010 | 3,394 | 3,000 | 3,441 | 3,540 | 3,635 | 3,513 | 3,799 | 3,527 | 3,603 | 3,732 | 3,587 | 3,684 |
| 2011 | 3,491 | 3,402 | 3,589 | 3,267 | 3,125 | 3,773 | 4,107 | 3,861 | 3,722 | 3,795 | 3,530 | 3,591 |
| 2012 | 3,326 | 3,207 | 3,442 | 3,533 | 3,541 | 3,543 | 3,913 | 4,095 | 3,796 | 3,772 | 3,649 | 3,662 |
| 2013 | 3,651 | 3,281 | 3,982 | 3,535 | 3,525 | 3,606 | 3,708 | 3,675 | 3,608 | 3,989 | 3,516 | 3,676 |
| 2014 | 3,629 | 3,139 | 3,535 | 3,416 | 3,359 | 3,099 | 3,967 | 3,598 | 3,635 | 3,666 | 3,310 | 3,852 |
| 2015 | 3,775 | 2,828 | 3,590 | 3,350 | 3,254 | 3,441 | 3,776 | 3,534 | 3,515 | 3,259 | 3,239 | 3,548 |
| 2016 | 3,499 | 3,050 | 3,543 | 3,779 | 3,397 | 3,480 | 4,038 | 3,825 | 3,409 | 2,980 | 3,276 | 3,841 |
| 2017 | 3,500 | 3,033 | 3,637 | 3,944 | 3,661 | 3,361 | 3,769 | 3,943 | 3,732 | 3,171 | 3,573 | 4,027 |
| 2018 | 3,471 | 3,436 | 3,962 | 3,757 | 3,832 | 3,788 | 3,855 | 4,052 | 3,712 | 3,473 | 3,455 | 3,748 |
| 2019 | 3,561 | 3,065 | 3,842 | 3,396 | 3,165 | 3,391 | 3,857 | 3,846 | 3,217 | 3,313 | 3,573 | 4,056 |
| 2020 | 3,541 | 3,627 | 3,390 | 2,370 | 2,215 | 2,025 | 2,541 | 2,962 | 2,955 | 2,902 | 2,775 | 2,785 |
| 2021 | 2,655 | 2,294 | 2,678 | 2,962 | 3,079 | 3,022 | 2,834 | 3,047 | 2,992 | 2,917 | 2,895 | 3,066 |
| 2022 | 2,519 | 2,648 | 2,985 | 3,002 | 3,269 | 2,990 | 3,060 | 2,929 | 2,800 | 3,113 | 2,957 | 3,184 |
| 2023 | 2,679 | 2,612 | 3,084 | 2,958 | 3,049 | 3,259 | 2,967 | 2,986 | 2,966 | 2,529 | 2,449 | 2,780 |
| 2024 | 2,727 | 2,326 | 2,605 | 2,648 | 2,738 | 2,483 | ||||||
| - = No Data Reported; -- = Not Applicable; NA = Not Available; W = Withheld to avoid disclosure of individual company data. |
| Release Date: 8/30/2024 |
| Next Release Date: 9/30/2024 |