|
Download Data (XLS File) |
|
||||||||
|
||||||||
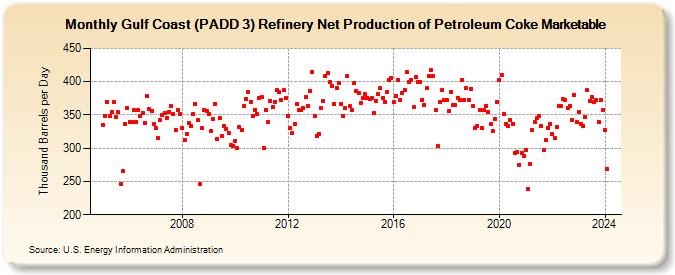
| Gulf Coast (PADD 3) Refinery Net Production of Petroleum Coke Marketable (Thousand Barrels per Day) | ||||||||
| Year | Jan | Feb | Mar | Apr | May | Jun | Jul | Aug | Sep | Oct | Nov | Dec |
|---|---|---|---|---|---|---|---|---|---|---|---|---|
| 2005 | 335 | 349 | 369 | 348 | 354 | 370 | 347 | 354 | 246 | 265 | 337 | 361 |
| 2006 | 340 | 340 | 357 | 340 | 357 | 349 | 353 | 338 | 378 | 359 | 356 | 336 |
| 2007 | 330 | 315 | 343 | 350 | 353 | 346 | 355 | 363 | 351 | 327 | 357 | 351 |
| 2008 | 330 | 313 | 321 | 338 | 334 | 352 | 367 | 342 | 246 | 330 | 357 | 356 |
| 2009 | 352 | 326 | 344 | 367 | 314 | 345 | 318 | 333 | 329 | 323 | 305 | 304 |
| 2010 | 311 | 300 | 332 | 327 | 364 | 374 | 384 | 370 | 349 | 358 | 351 | 376 |
| 2011 | 377 | 300 | 358 | 340 | 371 | 362 | 370 | 387 | 384 | 372 | 387 | 375 |
| 2012 | 349 | 331 | 323 | 337 | 367 | 357 | 358 | 360 | 377 | 364 | 386 | 415 |
| 2013 | 348 | 319 | 322 | 360 | 371 | 408 | 413 | 399 | 393 | 366 | 391 | 398 |
| 2014 | 367 | 349 | 360 | 408 | 363 | 358 | 398 | 386 | 383 | 368 | 375 | 382 |
| 2015 | 376 | 374 | 375 | 353 | 371 | 381 | 390 | 376 | 370 | 384 | 403 | 406 |
| 2016 | 369 | 379 | 402 | 373 | 383 | 388 | 415 | 399 | 402 | 362 | 407 | 400 |
| 2017 | 400 | 373 | 365 | 390 | 409 | 417 | 408 | 357 | 303 | 370 | 387 | 372 |
| 2018 | 372 | 356 | 385 | 365 | 365 | 376 | 373 | 403 | 373 | 391 | 372 | 389 |
| 2019 | 364 | 330 | 334 | 358 | 330 | 357 | 364 | 355 | 336 | 326 | 344 | 369 |
| 2020 | 402 | 410 | 352 | 337 | 333 | 342 | 336 | 293 | 294 | 275 | 293 | 289 |
| 2021 | 297 | 238 | 276 | 328 | 339 | 345 | 348 | 333 | 298 | 312 | 330 | 336 |
| 2022 | 321 | 316 | 332 | 363 | 363 | 374 | 373 | 360 | 364 | 342 | 380 | 339 |
| 2023 | 355 | 336 | 334 | 347 | 387 | 371 | 377 | 369 | 372 | 340 | 373 | 357 |
| 2024 | 327 | |||||||||||
| - = No Data Reported; -- = Not Applicable; NA = Not Available; W = Withheld to avoid disclosure of individual company data. |
| Release Date: 3/29/2024 |
| Next Release Date: 4/30/2024 |