|
Download Data (XLS File) |
|
||||||||
|
||||||||
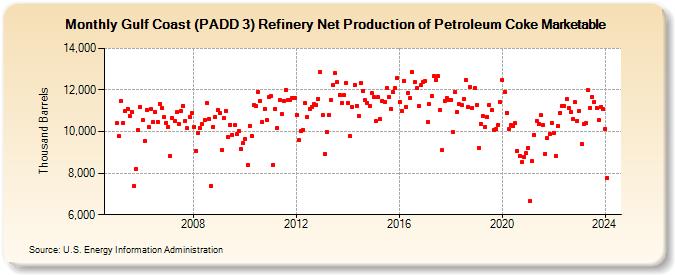
| Gulf Coast (PADD 3) Refinery Net Production of Petroleum Coke Marketable (Thousand Barrels) | ||||||||
| Year | Jan | Feb | Mar | Apr | May | Jun | Jul | Aug | Sep | Oct | Nov | Dec |
|---|---|---|---|---|---|---|---|---|---|---|---|---|
| 2005 | 10,388 | 9,768 | 11,447 | 10,431 | 10,971 | 11,107 | 10,747 | 10,962 | 7,387 | 8,218 | 10,096 | 11,193 |
| 2006 | 10,542 | 9,532 | 11,059 | 10,211 | 11,069 | 10,457 | 10,941 | 10,468 | 11,331 | 11,142 | 10,681 | 10,426 |
| 2007 | 10,223 | 8,813 | 10,641 | 10,492 | 10,935 | 10,367 | 10,991 | 11,251 | 10,531 | 10,147 | 10,705 | 10,884 |
| 2008 | 10,221 | 9,072 | 9,951 | 10,153 | 10,357 | 10,565 | 11,384 | 10,614 | 7,382 | 10,243 | 10,701 | 11,048 |
| 2009 | 10,904 | 9,120 | 10,652 | 11,006 | 9,738 | 10,338 | 9,851 | 10,312 | 9,867 | 10,020 | 9,138 | 9,430 |
| 2010 | 9,637 | 8,402 | 10,290 | 9,799 | 11,273 | 11,207 | 11,916 | 11,475 | 10,465 | 11,101 | 10,542 | 11,667 |
| 2011 | 11,695 | 8,408 | 11,105 | 10,188 | 11,515 | 10,848 | 11,459 | 12,011 | 11,530 | 11,539 | 11,619 | 11,617 |
| 2012 | 10,818 | 9,587 | 10,019 | 10,098 | 11,362 | 10,699 | 11,101 | 11,166 | 11,316 | 11,285 | 11,587 | 12,858 |
| 2013 | 10,782 | 8,920 | 9,979 | 10,787 | 11,512 | 12,232 | 12,807 | 12,370 | 11,778 | 11,359 | 11,740 | 12,348 |
| 2014 | 11,391 | 9,782 | 11,173 | 12,231 | 11,253 | 10,751 | 12,351 | 11,973 | 11,502 | 11,393 | 11,245 | 11,831 |
| 2015 | 11,656 | 10,484 | 11,639 | 10,604 | 11,486 | 11,429 | 12,098 | 11,660 | 11,095 | 11,901 | 12,093 | 12,572 |
| 2016 | 11,444 | 10,997 | 12,452 | 11,179 | 11,871 | 11,631 | 12,857 | 12,378 | 12,074 | 11,226 | 12,219 | 12,404 |
| 2017 | 12,410 | 10,452 | 11,313 | 11,696 | 12,672 | 12,501 | 12,648 | 11,053 | 9,090 | 11,472 | 11,609 | 11,532 |
| 2018 | 11,538 | 9,960 | 11,926 | 10,959 | 11,325 | 11,271 | 11,575 | 12,485 | 11,191 | 12,119 | 11,147 | 12,074 |
| 2019 | 11,289 | 9,232 | 10,366 | 10,729 | 10,242 | 10,701 | 11,282 | 11,019 | 10,074 | 10,120 | 10,314 | 11,438 |
| 2020 | 12,477 | 11,893 | 10,910 | 10,100 | 10,325 | 10,252 | 10,409 | 9,072 | 8,830 | 8,526 | 8,776 | 8,947 |
| 2021 | 9,199 | 6,667 | 8,567 | 9,830 | 10,513 | 10,364 | 10,781 | 10,310 | 8,943 | 9,673 | 9,890 | 10,423 |
| 2022 | 9,954 | 8,847 | 10,286 | 10,895 | 11,241 | 11,217 | 11,550 | 11,145 | 10,932 | 10,602 | 11,405 | 10,520 |
| 2023 | 11,004 | 9,406 | 10,350 | 10,399 | 11,996 | 11,140 | 11,595 | 11,424 | 11,242 | 10,537 | 11,193 | 11,079 |
| 2024 | 10,130 | 7,773 | 10,212 | 10,827 | 10,968 | 11,298 | ||||||
| - = No Data Reported; -- = Not Applicable; NA = Not Available; W = Withheld to avoid disclosure of individual company data. |
| Release Date: 8/30/2024 |
| Next Release Date: 9/30/2024 |