|
Download Data (XLS File) |
|
||||||||
|
||||||||
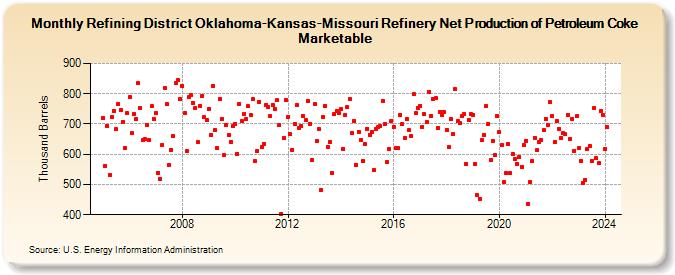
| Refining District Oklahoma-Kansas-Missouri Refinery Net Production of Petroleum Coke Marketable (Thousand Barrels) | ||||||||
| Year | Jan | Feb | Mar | Apr | May | Jun | Jul | Aug | Sep | Oct | Nov | Dec |
|---|---|---|---|---|---|---|---|---|---|---|---|---|
| 2005 | 721 | 562 | 693 | 531 | 723 | 744 | 682 | 767 | 746 | 707 | 620 | 735 |
| 2006 | 788 | 669 | 734 | 717 | 834 | 753 | 646 | 649 | 698 | 646 | 759 | 717 |
| 2007 | 735 | 539 | 518 | 631 | 819 | 765 | 564 | 615 | 660 | 834 | 844 | 783 |
| 2008 | 825 | 735 | 609 | 789 | 797 | 770 | 753 | 639 | 761 | 793 | 722 | 713 |
| 2009 | 750 | 664 | 827 | 680 | 619 | 783 | 717 | 596 | 697 | 664 | 642 | 693 |
| 2010 | 701 | 601 | 766 | 709 | 732 | 716 | 758 | 730 | 781 | 576 | 610 | 773 |
| 2011 | 623 | 633 | 763 | 757 | 725 | 764 | 750 | 778 | 697 | 404 | 653 | 780 |
| 2012 | 724 | 666 | 615 | 699 | 762 | 688 | 693 | 726 | 712 | 776 | 701 | 581 |
| 2013 | 766 | 644 | 683 | 482 | 723 | 761 | 624 | 640 | 537 | 732 | 744 | 735 |
| 2014 | 750 | 618 | 730 | 755 | 784 | 671 | 711 | 566 | 675 | 647 | 576 | 633 |
| 2015 | 685 | 664 | 674 | 549 | 685 | 691 | 692 | 777 | 700 | 573 | 618 | 711 |
| 2016 | 690 | 622 | 620 | 730 | 699 | 654 | 716 | 679 | 661 | 798 | 737 | 754 |
| 2017 | 761 | 691 | 732 | 705 | 807 | 727 | 784 | 785 | 687 | 740 | 731 | 739 |
| 2018 | 680 | 623 | 716 | 667 | 815 | 709 | 703 | 725 | 732 | 569 | 714 | 733 |
| 2019 | 731 | 568 | 465 | 452 | 646 | 664 | 760 | 700 | 580 | 644 | 597 | 728 |
| 2020 | 672 | 629 | 507 | 538 | 634 | 537 | 601 | 583 | 568 | 591 | 558 | 631 |
| 2021 | 645 | 436 | 509 | 578 | 654 | 613 | 640 | 647 | 680 | 717 | 695 | 772 |
| 2022 | 727 | 641 | 710 | 685 | 654 | 670 | 666 | 729 | 651 | 716 | 612 | 725 |
| 2023 | 619 | 579 | 506 | 516 | 618 | 627 | 579 | 754 | 587 | 570 | 743 | 730 |
| 2024 | 617 | |||||||||||
| - = No Data Reported; -- = Not Applicable; NA = Not Available; W = Withheld to avoid disclosure of individual company data. |
| Release Date: 3/29/2024 |
| Next Release Date: 4/30/2024 |