|
Download Data (XLS File) |
|
||||||||
|
||||||||
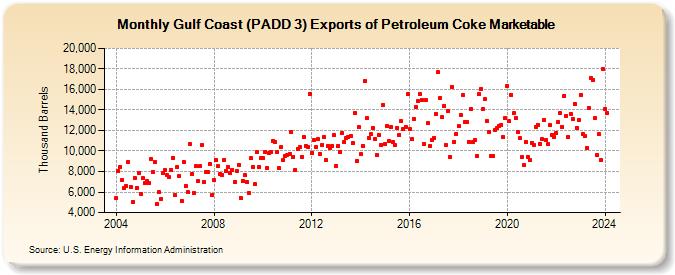
| Gulf Coast (PADD 3) Exports of Petroleum Coke Marketable (Thousand Barrels) | ||||||||
| Year | Jan | Feb | Mar | Apr | May | Jun | Jul | Aug | Sep | Oct | Nov | Dec |
|---|---|---|---|---|---|---|---|---|---|---|---|---|
| 2004 | 5,425 | 8,062 | 8,428 | 7,221 | 6,352 | 6,585 | 8,946 | 6,521 | 5,053 | 7,368 | 6,417 | 7,894 |
| 2005 | 5,835 | 7,324 | 6,858 | 7,089 | 6,870 | 9,224 | 7,977 | 8,963 | 4,855 | 5,971 | 5,354 | 7,849 |
| 2006 | 8,116 | 7,634 | 7,431 | 8,192 | 9,352 | 5,708 | 8,403 | 7,566 | 5,157 | 8,974 | 6,609 | 5,992 |
| 2007 | 10,691 | 7,743 | 5,927 | 8,495 | 7,042 | 8,501 | 10,603 | 6,970 | 7,969 | 7,937 | 8,749 | 5,739 |
| 2008 | 7,182 | 9,103 | 8,500 | 7,765 | 7,665 | 9,139 | 8,063 | 8,488 | 7,865 | 8,160 | 6,977 | 8,083 |
| 2009 | 8,621 | 5,466 | 7,089 | 7,619 | 6,986 | 5,935 | 9,290 | 8,443 | 6,736 | 9,873 | 8,446 | 9,312 |
| 2010 | 9,279 | 9,897 | 8,355 | 9,782 | 9,910 | 10,982 | 10,857 | 9,865 | 8,303 | 10,387 | 9,132 | 9,479 |
| 2011 | 9,630 | 9,716 | 11,813 | 9,449 | 8,157 | 10,212 | 10,345 | 9,442 | 11,386 | 10,493 | 10,404 | 15,586 |
| 2012 | 9,835 | 11,074 | 10,343 | 11,145 | 9,745 | 10,587 | 11,372 | 9,107 | 10,485 | 10,339 | 10,482 | 11,532 |
| 2013 | 8,580 | 10,496 | 9,890 | 11,735 | 10,896 | 11,227 | 11,330 | 11,460 | 10,779 | 13,694 | 9,015 | 12,316 |
| 2014 | 9,660 | 10,511 | 16,826 | 13,195 | 11,277 | 11,651 | 12,284 | 11,204 | 9,595 | 11,590 | 10,610 | 14,517 |
| 2015 | 10,724 | 12,435 | 10,996 | 12,307 | 10,856 | 10,569 | 12,287 | 11,536 | 12,898 | 12,113 | 12,387 | 15,514 |
| 2016 | 12,122 | 11,136 | 13,133 | 14,270 | 14,839 | 15,539 | 15,014 | 10,634 | 14,927 | 12,691 | 10,490 | 11,104 |
| 2017 | 11,272 | 13,617 | 17,658 | 15,173 | 13,267 | 14,416 | 10,576 | 13,901 | 9,426 | 16,261 | 10,922 | 11,693 |
| 2018 | 12,394 | 13,524 | 15,452 | 12,812 | 12,840 | 10,878 | 14,089 | 10,836 | 11,054 | 9,512 | 15,521 | 16,048 |
| 2019 | 14,077 | 15,032 | 12,937 | 11,864 | 9,476 | 9,499 | 12,091 | 12,193 | 12,459 | 12,560 | 11,361 | 13,179 |
| 2020 | 16,350 | 12,890 | 15,476 | 13,676 | 13,207 | 11,865 | 11,235 | 9,403 | 8,601 | 10,871 | 9,451 | 9,094 |
| 2021 | 10,817 | 10,626 | 12,347 | 12,535 | 10,717 | 11,121 | 13,013 | 11,054 | 10,667 | 12,496 | 11,556 | 11,339 |
| 2022 | 11,746 | 12,819 | 13,668 | 12,381 | 15,406 | 13,417 | 11,341 | 13,651 | 13,154 | 14,604 | 12,287 | 13,025 |
| 2023 | 15,503 | 11,640 | 11,442 | 10,272 | 14,199 | 17,110 | 16,891 | 13,168 | 9,587 | 11,615 | 9,102 | 18,009 |
| 2024 | 14,133 | |||||||||||
| - = No Data Reported; -- = Not Applicable; NA = Not Available; W = Withheld to avoid disclosure of individual company data. |
| Release Date: 3/29/2024 |
| Next Release Date: 4/30/2024 |