|
Download Data (XLS File) |
|
||||||||
|
||||||||
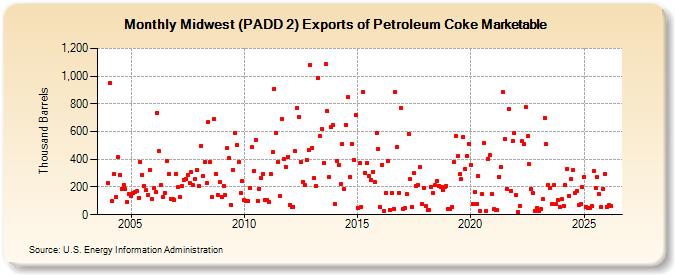
| Midwest (PADD 2) Exports of Petroleum Coke Marketable (Thousand Barrels) | ||||||||
| Year | Jan | Feb | Mar | Apr | May | Jun | Jul | Aug | Sep | Oct | Nov | Dec |
|---|---|---|---|---|---|---|---|---|---|---|---|---|
| 2004 | 228 | 952 | 100 | 293 | 127 | 414 | 283 | 188 | 214 | 182 | 92 | 152 |
| 2005 | 137 | 157 | 163 | 168 | 123 | 383 | 288 | 206 | 176 | 142 | 325 | 116 |
| 2006 | 190 | 162 | 737 | 457 | 216 | 131 | 160 | 389 | 293 | 116 | 113 | 108 |
| 2007 | 291 | 198 | 125 | 208 | 253 | 260 | 290 | 228 | 306 | 212 | 259 | 322 |
| 2008 | 205 | 497 | 278 | 383 | 227 | 671 | 379 | 128 | 689 | 292 | 144 | 234 |
| 2009 | 127 | 209 | 142 | 478 | 407 | 71 | 326 | 593 | 500 | 377 | 155 | 242 |
| 2010 | 107 | 97 | 98 | 193 | 486 | 318 | 542 | 102 | 189 | 264 | 293 | 105 |
| 2011 | 108 | 93 | 293 | 452 | 909 | 588 | 379 | 133 | 692 | 401 | 345 | 420 |
| 2012 | 72 | 53 | 59 | 458 | 773 | 705 | 377 | 238 | 213 | 395 | 466 | 1,083 |
| 2013 | 482 | 267 | 209 | 988 | 565 | 621 | 376 | 1,087 | 747 | 271 | 631 | 644 |
| 2014 | 74 | 388 | 357 | 220 | 513 | 184 | 649 | 848 | 270 | 512 | 397 | 718 |
| 2015 | 48 | 373 | 58 | 886 | 302 | 371 | 277 | 252 | 311 | 234 | 591 | 475 |
| 2016 | 54 | 361 | 26 | 157 | 385 | 35 | 158 | 44 | 884 | 491 | 160 | 773 |
| 2017 | 44 | 45 | 148 | 584 | 255 | 57 | 298 | 205 | 216 | 346 | 77 | 195 |
| 2018 | 60 | 32 | 31 | 202 | 158 | 212 | 240 | 207 | 197 | 175 | 199 | 208 |
| 2019 | 40 | 44 | 56 | 378 | 571 | 422 | 291 | 256 | 561 | 333 | 426 | 510 |
| 2020 | 360 | 79 | 165 | 80 | 278 | 25 | 150 | 515 | 27 | 402 | 429 | 147 |
| 2021 | 40 | 33 | 32 | 271 | 347 | 883 | 545 | 186 | 760 | 170 | 531 | 588 |
| 2022 | 144 | 17 | 64 | 529 | 508 | 776 | 565 | 364 | 183 | 154 | 30 | 47 |
| 2023 | 27 | 38 | 110 | 700 | 507 | 215 | 192 | 78 | 216 | 77 | 106 | 57 |
| 2024 | 110 | |||||||||||
| - = No Data Reported; -- = Not Applicable; NA = Not Available; W = Withheld to avoid disclosure of individual company data. |
| Release Date: 3/29/2024 |
| Next Release Date: 4/30/2024 |