|
Download Data (XLS File) |
|
||||||||
|
||||||||
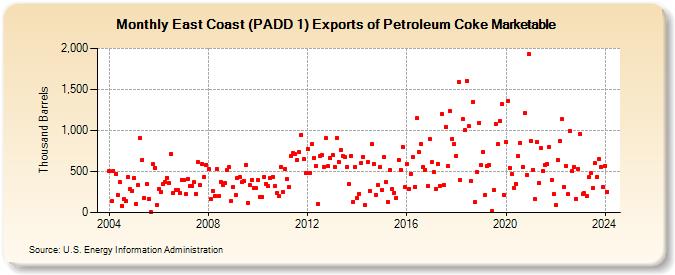
| East Coast (PADD 1) Exports of Petroleum Coke Marketable (Thousand Barrels) | ||||||||
| Year | Jan | Feb | Mar | Apr | May | Jun | Jul | Aug | Sep | Oct | Nov | Dec |
|---|---|---|---|---|---|---|---|---|---|---|---|---|
| 2004 | 501 | 138 | 510 | 473 | 208 | 369 | 85 | 161 | 139 | 434 | 288 | 268 |
| 2005 | 427 | 104 | 330 | 911 | 644 | 179 | 348 | 164 | 8 | 588 | 548 | 94 |
| 2006 | 290 | 250 | 344 | 378 | 425 | 359 | 718 | 240 | 273 | 277 | 242 | 397 |
| 2007 | 391 | 226 | 411 | 321 | 328 | 368 | 232 | 610 | 330 | 596 | 432 | 584 |
| 2008 | 529 | 162 | 268 | 200 | 533 | 204 | 373 | 331 | 363 | 523 | 550 | 142 |
| 2009 | 312 | 212 | 420 | 433 | 368 | 383 | 581 | 120 | 330 | 398 | 304 | 295 |
| 2010 | 401 | 194 | 192 | 438 | 350 | 319 | 423 | 439 | 324 | 238 | 197 | 556 |
| 2011 | 253 | 532 | 403 | 316 | 685 | 727 | 708 | 641 | 736 | 950 | 647 | 477 |
| 2012 | 773 | 482 | 830 | 670 | 566 | 107 | 683 | 700 | 558 | 903 | 564 | 661 |
| 2013 | 700 | 560 | 912 | 620 | 759 | 692 | 678 | 560 | 344 | 690 | 134 | 557 |
| 2014 | 172 | 231 | 605 | 679 | 92 | 615 | 264 | 832 | 592 | 218 | 337 | 552 |
| 2015 | 276 | 673 | 375 | 126 | 518 | 286 | 242 | 183 | 645 | 523 | 802 | 314 |
| 2016 | 590 | 288 | 475 | 674 | 316 | 1,146 | 736 | 836 | 557 | 523 | 324 | 898 |
| 2017 | 614 | 489 | 292 | 594 | 329 | 1,204 | 339 | 1,048 | 567 | 1,232 | 902 | 836 |
| 2018 | 686 | 1,591 | 395 | 1,135 | 1,000 | 1,602 | 1,054 | 381 | 1,351 | 125 | 495 | 1,095 |
| 2019 | 576 | 736 | 219 | 562 | 579 | 13 | 274 | 1,083 | 831 | 1,117 | 1,321 | 220 |
| 2020 | 862 | 1,359 | 542 | 471 | 305 | 354 | 684 | 849 | 557 | 1,210 | 460 | 1,929 |
| 2021 | 876 | 524 | 166 | 860 | 364 | 782 | 503 | 585 | 593 | 804 | 396 | 228 |
| 2022 | 87 | 646 | 876 | 1,135 | 315 | 570 | 223 | 995 | 505 | 559 | 168 | 531 |
| 2023 | 963 | 226 | 233 | 197 | 429 | 478 | 299 | 602 | 434 | 650 | 552 | 309 |
| 2024 | 572 | |||||||||||
| - = No Data Reported; -- = Not Applicable; NA = Not Available; W = Withheld to avoid disclosure of individual company data. |
| Release Date: 3/29/2024 |
| Next Release Date: 4/30/2024 |