|
Download Data (XLS File) |
|
||||||||
|
||||||||
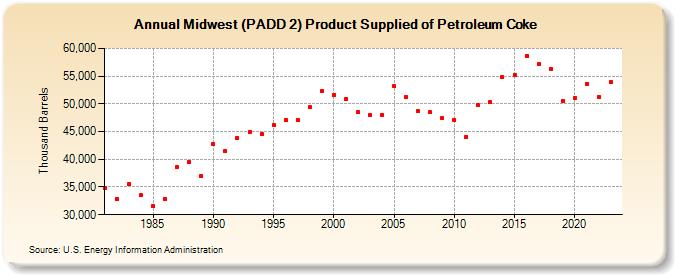
| Midwest (PADD 2) Product Supplied of Petroleum Coke (Thousand Barrels) | ||||||||
| Decade | Year-0 | Year-1 | Year-2 | Year-3 | Year-4 | Year-5 | Year-6 | Year-7 | Year-8 | Year-9 |
|---|---|---|---|---|---|---|---|---|---|---|
| 1980's | 34,880 | 32,821 | 35,564 | 33,528 | 31,613 | 32,899 | 38,650 | 39,435 | 36,943 | |
| 1990's | 42,700 | 41,448 | 43,875 | 44,941 | 44,549 | 46,167 | 47,146 | 47,159 | 49,345 | 52,336 |
| 2000's | 51,585 | 50,870 | 48,484 | 47,965 | 48,025 | 53,162 | 51,191 | 48,638 | 48,439 | 47,398 |
| 2010's | 47,053 | 44,088 | 49,733 | 50,309 | 54,777 | 55,261 | 58,656 | 57,143 | 56,356 | 50,466 |
| 2020's | 51,129 | 53,586 | 51,315 | 53,924 |
| - = No Data Reported; -- = Not Applicable; NA = Not Available; W = Withheld to avoid disclosure of individual company data. |
| Release Date: 3/29/2024 |
| Next Release Date: 8/30/2024 |