|
Download Data (XLS File) |
|
||||||||
|
||||||||
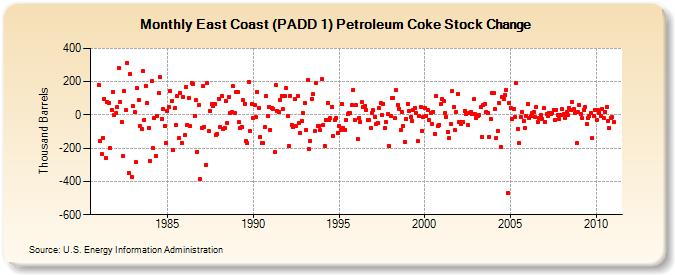
| East Coast (PADD 1) Petroleum Coke Stock Change (Thousand Barrels) | ||||||||
| Year | Jan | Feb | Mar | Apr | May | Jun | Jul | Aug | Sep | Oct | Nov | Dec |
|---|---|---|---|---|---|---|---|---|---|---|---|---|
| 1981 | 180 | -158 | -236 | -136 | 98 | -257 | 76 | 73 | -199 | 32 | 140 | 2 |
| 1982 | 11 | 46 | 283 | 78 | -40 | -249 | 142 | 29 | 314 | -347 | 248 | -373 |
| 1983 | 53 | 15 | -284 | 159 | 89 | -66 | -84 | 262 | -28 | 175 | 70 | -80 |
| 1984 | -275 | 202 | -201 | -19 | -244 | -9 | 129 | 227 | -27 | 35 | -65 | -170 |
| 1985 | 25 | 46 | 143 | 82 | -212 | 40 | -60 | 115 | -139 | 130 | -166 | 109 |
| 1986 | -123 | 169 | -58 | 103 | -68 | 193 | 188 | -5 | 87 | -222 | 61 | -387 |
| 1987 | -76 | 176 | -70 | -301 | 191 | -96 | 24 | 64 | 56 | 68 | -120 | -112 |
| 1988 | 96 | -72 | 113 | -85 | -76 | 82 | -46 | 109 | 12 | 19 | 172 | 12 |
| 1989 | 135 | 138 | -45 | -81 | -70 | 87 | 68 | -155 | -171 | 199 | -99 | 67 |
| 1990 | -21 | 59 | -13 | 137 | 42 | -131 | -168 | -169 | -74 | 113 | -4 | 49 |
| 1991 | -90 | 39 | 38 | -225 | 181 | 26 | 15 | 92 | 115 | 34 | 113 | 160 |
| 1992 | -4 | -186 | 114 | -60 | -70 | 94 | -69 | 116 | -47 | -107 | -36 | 9 |
| 1993 | 71 | -91 | 208 | -206 | -157 | 98 | 123 | -99 | 189 | -68 | -65 | -93 |
| 1994 | 213 | -63 | -187 | -32 | 72 | -30 | -21 | 49 | -128 | -32 | -18 | -107 |
| 1995 | -66 | -91 | 66 | -76 | -89 | -32 | 3 | 12 | 9 | 61 | 151 | -30 |
| 1996 | 57 | -146 | -21 | -43 | 76 | 49 | 53 | 30 | -28 | -33 | -78 | 12 |
| 1997 | 30 | -10 | -56 | -47 | 43 | 73 | -1 | 66 | -80 | -42 | 4 | -186 |
| 1998 | -9 | 103 | 104 | -20 | 147 | 61 | 38 | -90 | 15 | -68 | -161 | -26 |
| 1999 | 67 | 26 | -13 | -34 | 30 | 43 | 13 | -159 | -9 | 48 | -94 | -13 |
| 2000 | 42 | -4 | 31 | -32 | 13 | -52 | 17 | -113 | 111 | -68 | -60 | 63 |
| 2001 | 98 | 83 | 10 | -12 | -100 | -140 | -55 | 141 | 50 | -92 | 20 | 127 |
| 2002 | -45 | -52 | -40 | -43 | 26 | 3 | -61 | 12 | 19 | 6 | 93 | 3 |
| 2003 | -17 | -4 | 1 | 45 | -131 | 57 | 66 | 18 | 9 | -132 | -25 | 134 |
| 2004 | 131 | 33 | -138 | -94 | 71 | -191 | 109 | 95 | 117 | 151 | -468 | 71 |
| 2005 | 43 | -27 | 38 | -14 | 191 | -84 | -169 | -12 | 19 | -36 | -80 | -8 |
| 2006 | 64 | -18 | -9 | 10 | 18 | -12 | 48 | -41 | -21 | 1 | -26 | 42 |
| 2007 | -44 | 4 | -4 | 12 | 5 | 13 | 30 | -32 | 32 | 2 | -26 | -2 |
| 2008 | 36 | 5 | -16 | 19 | -3 | 42 | 32 | 79 | 35 | 11 | -169 | 20 |
| 2009 | 60 | 8 | -21 | 32 | 49 | -56 | -21 | -8 | 14 | -141 | -7 | 28 |
| 2010 | -32 | 29 | 12 | -9 | 37 | -18 | 18 | 50 | -38 | -79 | -21 | -14 |
| 2011 | -43 | |||||||||||
| - = No Data Reported; -- = Not Applicable; NA = Not Available; W = Withheld to avoid disclosure of individual company data. |
| Release Date: 3/29/2024 |
| Next Release Date: 4/30/2024 |