|
Download Data (XLS File) |
|
||||||||
|
||||||||
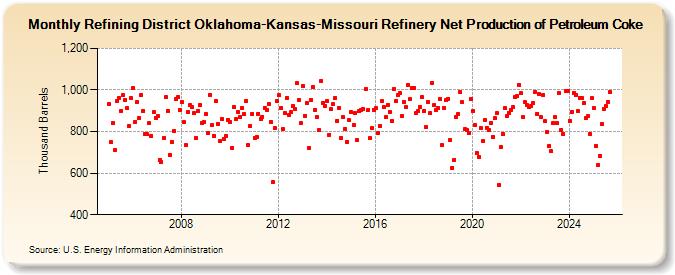
| Refining District Oklahoma-Kansas-Missouri Refinery Net Production of Petroleum Coke (Thousand Barrels) | ||||||||
| Year | Jan | Feb | Mar | Apr | May | Jun | Jul | Aug | Sep | Oct | Nov | Dec |
|---|---|---|---|---|---|---|---|---|---|---|---|---|
| 2005 | 932 | 749 | 841 | 709 | 948 | 962 | 901 | 974 | 954 | 912 | 828 | 960 |
| 2006 | 1,008 | 848 | 941 | 867 | 976 | 900 | 786 | 788 | 839 | 779 | 893 | 867 |
| 2007 | 873 | 663 | 653 | 769 | 965 | 900 | 688 | 751 | 801 | 955 | 965 | 904 |
| 2008 | 941 | 845 | 734 | 896 | 926 | 917 | 889 | 768 | 899 | 930 | 840 | 846 |
| 2009 | 884 | 792 | 978 | 830 | 781 | 947 | 838 | 753 | 860 | 766 | 780 | 857 |
| 2010 | 845 | 723 | 918 | 858 | 895 | 872 | 914 | 884 | 946 | 733 | 826 | 886 |
| 2011 | 771 | 776 | 886 | 861 | 872 | 914 | 904 | 934 | 847 | 555 | 817 | 946 |
| 2012 | 974 | 914 | 811 | 888 | 963 | 882 | 893 | 922 | 908 | 1,032 | 953 | 841 |
| 2013 | 1,020 | 876 | 936 | 721 | 954 | 1,013 | 906 | 869 | 808 | 1,045 | 939 | 924 |
| 2014 | 945 | 784 | 907 | 931 | 962 | 853 | 914 | 769 | 868 | 814 | 751 | 854 |
| 2015 | 892 | 831 | 888 | 760 | 897 | 903 | 909 | 1,005 | 902 | 767 | 815 | 906 |
| 2016 | 912 | 792 | 826 | 945 | 918 | 868 | 929 | 896 | 853 | 1,005 | 946 | 978 |
| 2017 | 984 | 877 | 942 | 917 | 1,025 | 955 | 1,009 | 1,010 | 887 | 900 | 917 | 966 |
| 2018 | 899 | 822 | 943 | 889 | 1,035 | 927 | 903 | 913 | 957 | 734 | 911 | 951 |
| 2019 | 958 | 757 | 627 | 665 | 870 | 885 | 989 | 940 | 811 | 806 | 793 | 956 |
| 2020 | 899 | 832 | 697 | 677 | 818 | 753 | 854 | 819 | 807 | 842 | 774 | 863 |
| 2021 | 887 | 543 | 725 | 788 | 913 | 875 | 891 | 906 | 916 | 964 | 969 | 1,025 |
| 2022 | 984 | 868 | 940 | 927 | 917 | 925 | 938 | 992 | 886 | 980 | 868 | 976 |
| 2023 | 849 | 798 | 732 | 705 | 841 | 868 | 839 | 985 | 808 | 790 | 997 | 997 |
| 2024 | 853 | |||||||||||
| - = No Data Reported; -- = Not Applicable; NA = Not Available; W = Withheld to avoid disclosure of individual company data. |
| Release Date: 3/29/2024 |
| Next Release Date: 4/30/2024 |