|
Download Data (XLS File) |
|
||||||||
|
||||||||
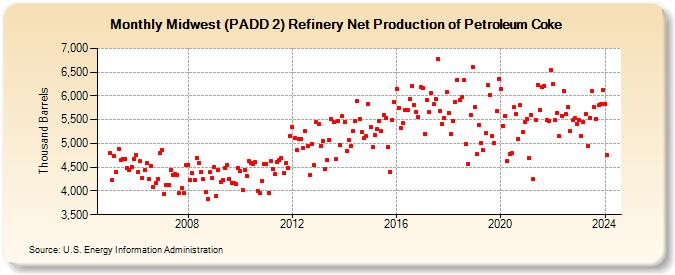
| Midwest (PADD 2) Refinery Net Production of Petroleum Coke (Thousand Barrels) | ||||||||
| Year | Jan | Feb | Mar | Apr | May | Jun | Jul | Aug | Sep | Oct | Nov | Dec |
|---|---|---|---|---|---|---|---|---|---|---|---|---|
| 2005 | 4,803 | 4,229 | 4,731 | 4,403 | 4,888 | 4,651 | 4,668 | 4,675 | 4,490 | 4,440 | 4,514 | 4,675 |
| 2006 | 4,763 | 4,406 | 4,620 | 4,279 | 4,432 | 4,588 | 4,255 | 4,526 | 4,077 | 4,157 | 4,252 | 4,801 |
| 2007 | 4,857 | 3,942 | 4,129 | 4,133 | 4,451 | 4,335 | 4,347 | 4,335 | 3,949 | 4,058 | 3,957 | 4,549 |
| 2008 | 4,547 | 4,239 | 4,371 | 4,227 | 4,698 | 4,586 | 4,401 | 4,249 | 3,978 | 3,824 | 4,389 | 4,275 |
| 2009 | 4,507 | 3,894 | 4,436 | 4,193 | 4,228 | 4,473 | 4,549 | 4,260 | 4,163 | 4,177 | 4,153 | 4,483 |
| 2010 | 4,418 | 4,026 | 4,440 | 4,325 | 4,636 | 4,578 | 4,563 | 4,603 | 4,006 | 3,952 | 4,201 | 4,577 |
| 2011 | 4,559 | 3,964 | 4,626 | 4,453 | 4,347 | 4,618 | 4,647 | 4,696 | 4,375 | 4,583 | 4,480 | 5,163 |
| 2012 | 5,338 | 5,109 | 4,865 | 5,096 | 5,098 | 4,905 | 5,265 | 4,937 | 4,341 | 4,996 | 4,543 | 5,449 |
| 2013 | 5,418 | 4,950 | 5,059 | 4,458 | 4,660 | 5,080 | 5,521 | 5,442 | 4,662 | 5,470 | 4,972 | 5,568 |
| 2014 | 5,455 | 4,840 | 5,069 | 4,943 | 5,252 | 5,472 | 5,900 | 5,516 | 5,243 | 5,106 | 5,158 | 5,830 |
| 2015 | 5,345 | 4,924 | 5,169 | 5,299 | 5,474 | 5,259 | 5,589 | 5,535 | 4,928 | 4,399 | 5,494 | 5,866 |
| 2016 | 6,154 | 5,753 | 5,335 | 5,420 | 5,702 | 5,695 | 5,944 | 6,218 | 5,812 | 5,658 | 5,553 | 6,178 |
| 2017 | 6,159 | 5,205 | 5,924 | 5,655 | 6,059 | 5,820 | 5,938 | 6,786 | 5,681 | 5,418 | 5,537 | 6,073 |
| 2018 | 5,649 | 5,206 | 5,475 | 5,878 | 6,342 | 5,922 | 5,967 | 6,337 | 4,994 | 4,567 | 5,607 | 6,607 |
| 2019 | 5,770 | 4,768 | 5,393 | 5,011 | 4,852 | 5,210 | 6,237 | 6,026 | 5,146 | 5,014 | 5,681 | 6,362 |
| 2020 | 6,147 | 5,374 | 5,580 | 4,633 | 4,780 | 4,797 | 5,757 | 5,624 | 5,103 | 5,805 | 5,238 | 5,441 |
| 2021 | 5,510 | 4,692 | 5,601 | 4,247 | 5,496 | 6,240 | 5,702 | 6,179 | 6,205 | 5,485 | 5,481 | 6,550 |
| 2022 | 6,255 | 5,498 | 5,648 | 5,155 | 5,584 | 6,099 | 5,617 | 5,765 | 5,270 | 5,489 | 5,526 | 5,415 |
| 2023 | 5,490 | 5,157 | 5,461 | 5,611 | 4,936 | 5,540 | 6,109 | 5,765 | 5,515 | 5,803 | 5,832 | 6,121 |
| 2024 | 5,837 | |||||||||||
| - = No Data Reported; -- = Not Applicable; NA = Not Available; W = Withheld to avoid disclosure of individual company data. |
| Release Date: 3/29/2024 |
| Next Release Date: 4/30/2024 |
Referring Pages: