|
Download Data (XLS File) |
|
||||||||
|
||||||||
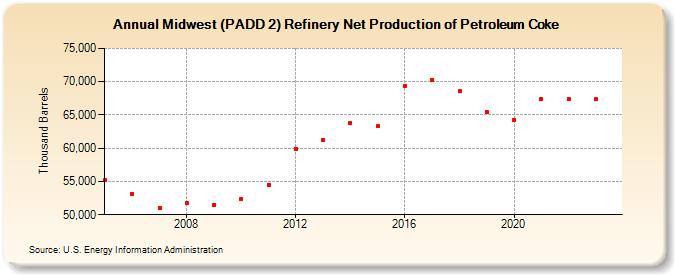
| Midwest (PADD 2) Refinery Net Production of Petroleum Coke (Thousand Barrels) | ||||||||
| Decade | Year-0 | Year-1 | Year-2 | Year-3 | Year-4 | Year-5 | Year-6 | Year-7 | Year-8 | Year-9 |
|---|---|---|---|---|---|---|---|---|---|---|
| 2000's | 55,167 | 53,156 | 51,042 | 51,784 | 51,516 | |||||
| 2010's | 52,325 | 54,511 | 59,942 | 61,260 | 63,784 | 63,281 | 69,422 | 70,255 | 68,551 | 65,470 |
| 2020's | 64,279 | 67,388 | 67,321 | 67,383 |
| - = No Data Reported; -- = Not Applicable; NA = Not Available; W = Withheld to avoid disclosure of individual company data. |
| Release Date: 8/30/2024 |
| Next Release Date: 8/29/2025 |
Referring Pages: