|
Download Data (XLS File) |
|
||||||||
|
||||||||
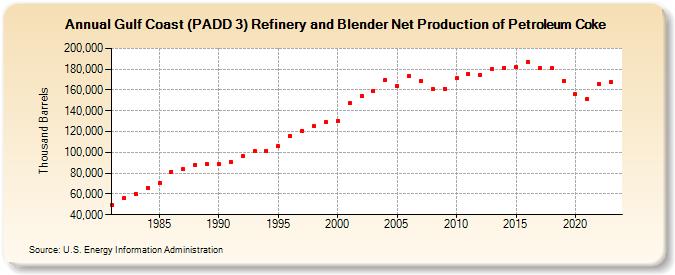
| Gulf Coast (PADD 3) Refinery and Blender Net Production of Petroleum Coke (Thousand Barrels) | ||||||||
| Decade | Year-0 | Year-1 | Year-2 | Year-3 | Year-4 | Year-5 | Year-6 | Year-7 | Year-8 | Year-9 |
|---|---|---|---|---|---|---|---|---|---|---|
| 1980's | 49,541 | 55,810 | 59,789 | 65,951 | 70,493 | 81,491 | 83,536 | 88,092 | 88,399 | |
| 1990's | 88,788 | 90,764 | 96,135 | 101,507 | 101,618 | 105,698 | 115,396 | 120,876 | 124,978 | 129,178 |
| 2000's | 130,575 | 147,222 | 154,601 | 159,049 | 169,745 | 163,796 | 173,251 | 168,670 | 161,039 | 161,415 |
| 2010's | 171,115 | 175,720 | 174,550 | 180,309 | 181,471 | 181,730 | 187,063 | 180,857 | 180,802 | 169,040 |
| 2020's | 156,015 | 151,427 | 165,507 | 167,624 |
| - = No Data Reported; -- = Not Applicable; NA = Not Available; W = Withheld to avoid disclosure of individual company data. |
| Release Date: 3/29/2024 |
| Next Release Date: 8/30/2024 |