|
Download Data (XLS File) |
|
||||||||
|
||||||||
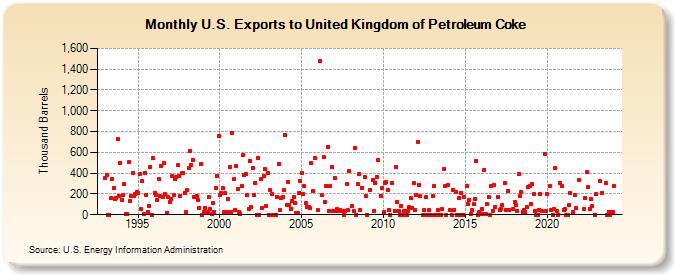
| U.S. Exports to United Kingdom of Petroleum Coke (Thousand Barrels) | ||||||||
| Year | Jan | Feb | Mar | Apr | May | Jun | Jul | Aug | Sep | Oct | Nov | Dec |
|---|---|---|---|---|---|---|---|---|---|---|---|---|
| 1993 | 350 | 386 | 2 | 0 | 158 | 345 | 261 | 154 | 163 | 730 | 181 | 501 |
| 1994 | 146 | 191 | 291 | 3 | 5 | 507 | 136 | 176 | 402 | 182 | 197 | 220 |
| 1995 | 205 | 395 | 58 | 321 | 3 | 405 | 191 | 28 | 88 | 457 | 0 | 545 |
| 1996 | 207 | 194 | 139 | 348 | 181 | 467 | 175 | 501 | 197 | 20 | 166 | 123 |
| 1997 | 148 | 373 | 191 | 344 | 363 | 475 | 377 | 181 | 401 | 401 | 213 | 29 |
| 1998 | 233 | 449 | 615 | 482 | 531 | 175 | 175 | 180 | 146 | 67 | 488 | 1 |
| 1999 | 30 | 61 | 20 | 23 | 167 | 56 | 3 | 109 | 28 | 259 | 376 | 757 |
| 2000 | 188 | 213 | 254 | 28 | 208 | 29 | 155 | 462 | 25 | 786 | 340 | 47 |
| 2001 | 467 | 246 | 27 | 11 | 281 | 575 | 383 | 388 | 188 | 59 | 517 | 74 |
| 2002 | 449 | 193 | 307 | 2 | 541 | 0 | 346 | 66 | 375 | 436 | 85 | 399 |
| 2003 | 2 | 235 | 196 | 0 | 2 | 0 | 174 | 491 | 50 | 162 | 169 | 236 |
| 2004 | 768 | 92 | 310 | 93 | 58 | 136 | 173 | 115 | 12 | 15 | 212 | 324 |
| 2005 | 405 | 204 | 273 | 108 | 72 | 73 | 60 | 496 | 231 | 541 | ||
| 2006 | 41 | 1,475 | 189 | 552 | 121 | 279 | 649 | 39 | 272 | 458 | 37 | |
| 2007 | 356 | 34 | 52 | 37 | 48 | 36 | 0 | 38 | 294 | 41 | 422 | |
| 2008 | 82 | 38 | 644 | 0 | 297 | 390 | 44 | 259 | 364 | 176 | ||
| 2009 | 0 | 242 | 338 | 39 | 306 | 358 | 528 | 183 | 257 | |||
| 2010 | 22 | 307 | 316 | 242 | 49 | 2 | 309 | 39 | 462 | 121 | 39 | |
| 2011 | 0 | 87 | 0 | 39 | 35 | 0 | 37 | 70 | 160 | 60 | 302 | 50 |
| 2012 | 191 | 703 | 289 | 177 | 1 | 43 | 167 | 0 | 44 | 0 | 0 | |
| 2013 | 176 | 277 | 0 | 0 | 43 | 1 | 0 | 55 | 440 | 275 | 1 | 288 |
| 2014 | 42 | 0 | 242 | 48 | 220 | 0 | 156 | 0 | 213 | 0 | 167 | |
| 2015 | 275 | 104 | 145 | 3 | 47 | 102 | 149 | 521 | 0 | 28 | 3 | |
| 2016 | 58 | 3 | 434 | 3 | 102 | 168 | 0 | 276 | 39 | 287 | 72 | |
| 2017 | 175 | 44 | 55 | 91 | 303 | 44 | 228 | 44 | 53 | |||
| 2018 | 127 | 96 | 39 | 390 | 177 | 223 | 28 | 44 | 28 | 72 | 270 | 275 |
| 2019 | 105 | 292 | 204 | 34 | 0 | 0 | 50 | 197 | 33 | 587 | 35 | |
| 2020 | 202 | 275 | 50 | 0 | 56 | 447 | 33 | 0 | 308 | 278 | ||
| 2021 | 50 | 51 | 0 | 0 | 90 | 205 | 28 | 189 | 61 | 338 | ||
| 2022 | 55 | 162 | 407 | 268 | 55 | 149 | 83 | 0 | ||||
| 2023 | 200 | 322 | 209 | 302 | 0 | 30 | 0 | 28 | ||||
| 2024 | 28 | |||||||||||
| - = No Data Reported; -- = Not Applicable; NA = Not Available; W = Withheld to avoid disclosure of individual company data. |
| Release Date: 3/29/2024 |
| Next Release Date: 4/30/2024 |