|
Download Data (XLS File) |
|
||||||||
|
||||||||
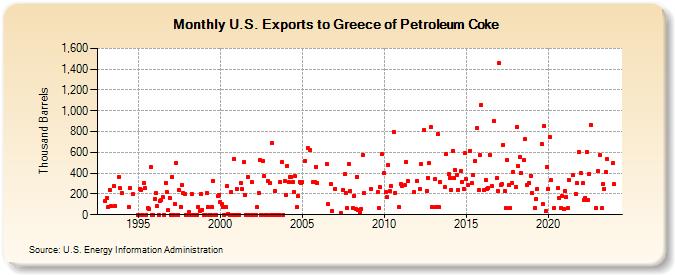
| U.S. Exports to Greece of Petroleum Coke (Thousand Barrels) | ||||||||
| Year | Jan | Feb | Mar | Apr | May | Jun | Jul | Aug | Sep | Oct | Nov | Dec |
|---|---|---|---|---|---|---|---|---|---|---|---|---|
| 1993 | 128 | 164 | 72 | 240 | 80 | 275 | 83 | 363 | 254 | |||
| 1994 | 209 | 77 | 255 | 195 | ||||||||
| 1995 | 0 | 246 | 238 | 0 | 303 | 257 | 0 | 64 | 59 | 457 | 0 | 0 |
| 1996 | 151 | 208 | 81 | 0 | 135 | 138 | 166 | 0 | 309 | 216 | 44 | 164 |
| 1997 | 0 | 363 | 0 | 104 | 496 | 0 | 237 | 78 | 286 | 209 | 203 | 0 |
| 1998 | 0 | 26 | 0 | 204 | 0 | 0 | 0 | 0 | 72 | 40 | 197 | 50 |
| 1999 | 0 | 0 | 212 | 72 | 0 | 0 | 72 | 325 | 0 | 0 | 176 | 190 |
| 2000 | 126 | 101 | 72 | 0 | 78 | 276 | 11 | 0 | 215 | 0 | 539 | 0 |
| 2001 | 245 | 0 | 0 | 308 | 246 | 504 | 193 | 0 | 363 | 0 | 0 | 314 |
| 2002 | 0 | 0 | 0 | 72 | 211 | 531 | 0 | 521 | 369 | 0 | 0 | 324 |
| 2003 | 304 | 0 | 688 | 0 | 230 | 0 | 0 | 0 | 312 | 506 | 0 | 321 |
| 2004 | 193 | 471 | 314 | 367 | 363 | 312 | 223 | 370 | 72 | 180 | 318 | 309 |
| 2005 | 316 | 518 | 640 | 621 | 319 | 319 | 463 | 302 | ||||
| 2006 | 484 | 99 | 292 | 35 | ||||||||
| 2007 | 250 | 21 | 240 | 389 | 212 | 63 | 490 | 226 | ||||
| 2008 | 66 | 182 | 58 | 363 | 46 | 29 | 55 | 578 | 209 | |||
| 2009 | 248 | 217 | 61 | 264 | 583 | |||||||
| 2010 | 398 | 215 | 169 | 478 | 230 | 273 | 796 | 212 | 72 | |||
| 2011 | 297 | 281 | 283 | 511 | 325 | 217 | ||||||
| 2012 | 326 | 248 | 487 | 819 | 226 | 354 | 496 | 839 | 75 | |||
| 2013 | 341 | 72 | 775 | 72 | 312 | 268 | 582 | 387 | ||||
| 2014 | 357 | 242 | 611 | 352 | 430 | 385 | 241 | 422 | 319 | 248 | 591 | |
| 2015 | 339 | 285 | 611 | 303 | 378 | 514 | 831 | 237 | 571 | 1,060 | ||
| 2016 | 236 | 336 | 250 | 253 | 578 | 275 | 903 | 352 | 232 | |||
| 2017 | 1,457 | 289 | 291 | 674 | 225 | 63 | 527 | 284 | 63 | 305 | 410 | |
| 2018 | 271 | 845 | 470 | 552 | 399 | 526 | 726 | 285 | 309 | 377 | ||
| 2019 | 212 | 63 | 151 | 252 | 682 | 99 | 854 | 33 | 457 | |||
| 2020 | 250 | 752 | 330 | 63 | 253 | 159 | 66 | 180 | 55 | |||
| 2021 | 232 | 172 | 66 | 337 | 380 | 200 | 303 | 603 | ||||
| 2022 | 398 | 303 | 138 | 165 | 605 | 143 | 396 | 867 | 66 | |||
| 2023 | 416 | 571 | 61 | 294 | 248 | 408 | 535 | 495 | ||||
| 2024 | 292 | |||||||||||
| - = No Data Reported; -- = Not Applicable; NA = Not Available; W = Withheld to avoid disclosure of individual company data. |
| Release Date: 3/29/2024 |
| Next Release Date: 4/30/2024 |