|
Download Data (XLS File) |
|
||||||||
|
||||||||
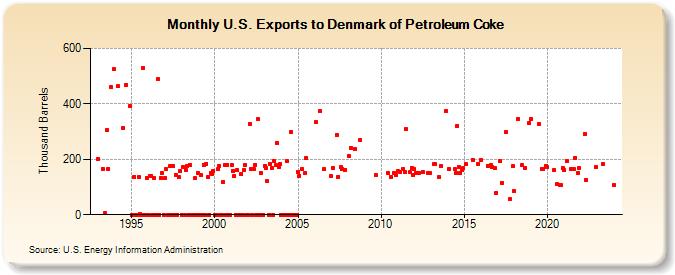
| U.S. Exports to Denmark of Petroleum Coke (Thousand Barrels) | ||||||||
| Year | Jan | Feb | Mar | Apr | May | Jun | Jul | Aug | Sep | Oct | Nov | Dec |
|---|---|---|---|---|---|---|---|---|---|---|---|---|
| 1993 | 201 | 166 | 6 | 304 | 166 | 459 | 524 | |||||
| 1994 | 464 | 314 | 468 | 393 | ||||||||
| 1995 | 0 | 0 | 137 | 0 | 0 | 135 | 3 | 0 | 531 | 0 | 0 | 134 |
| 1996 | 0 | 138 | 141 | 0 | 133 | 0 | 0 | 489 | 0 | 133 | 151 | 0 |
| 1997 | 133 | 165 | 0 | 0 | 175 | 0 | 176 | 0 | 145 | 0 | 135 | 157 |
| 1998 | 0 | 172 | 0 | 162 | 177 | 0 | 181 | 0 | 0 | 0 | 132 | 0 |
| 1999 | 151 | 0 | 142 | 0 | 181 | 0 | 184 | 137 | 0 | 150 | 146 | 157 |
| 2000 | 0 | 0 | 164 | 177 | 0 | 0 | 119 | 179 | 0 | 181 | 0 | 0 |
| 2001 | 180 | 159 | 141 | 0 | 161 | 0 | 0 | 147 | 0 | 163 | 180 | 0 |
| 2002 | 0 | 328 | 165 | 0 | 166 | 181 | 0 | 344 | 0 | 152 | 0 | 0 |
| 2003 | 176 | 168 | 120 | 0 | 184 | 170 | 0 | 193 | 179 | 259 | 171 | 184 |
| 2004 | 0 | 0 | 0 | 0 | 192 | 0 | 0 | 300 | 0 | 0 | 0 | 0 |
| 2005 | 155 | 141 | 165 | 149 | 204 | |||||||
| 2006 | 333 | 373 | 165 | |||||||||
| 2007 | 138 | 170 | 289 | 137 | 172 | 166 | 163 | |||||
| 2008 | 211 | 242 | 236 | 270 | ||||||||
| 2009 | 142 | |||||||||||
| 2010 | 152 | 137 | 152 | 143 | ||||||||
| 2011 | 156 | 155 | 165 | 153 | 309 | 153 | 169 | 144 | ||||
| 2012 | 164 | 150 | 152 | 155 | 152 | 150 | ||||||
| 2013 | 182 | 182 | 136 | 176 | 374 | |||||||
| 2014 | 165 | 164 | 151 | 321 | 172 | 150 | 162 | 167 | ||||
| 2015 | 182 | 198 | 184 | |||||||||
| 2016 | 198 | 177 | 178 | 173 | 169 | 79 | ||||||
| 2017 | 193 | 116 | 298 | 55 | 174 | |||||||
| 2018 | 85 | 345 | 178 | 170 | 331 | |||||||
| 2019 | 345 | 327 | 165 | 165 | 176 | |||||||
| 2020 | 171 | 161 | 110 | 107 | 106 | 168 | ||||||
| 2021 | 161 | 193 | 166 | 164 | 206 | 151 | 167 | |||||
| 2022 | 292 | 127 | 171 | |||||||||
| 2023 | 184 | |||||||||||
| 2024 | 107 | |||||||||||
| - = No Data Reported; -- = Not Applicable; NA = Not Available; W = Withheld to avoid disclosure of individual company data. |
| Release Date: 3/29/2024 |
| Next Release Date: 4/30/2024 |