|
Download Data (XLS File) |
|
||||||||
|
||||||||
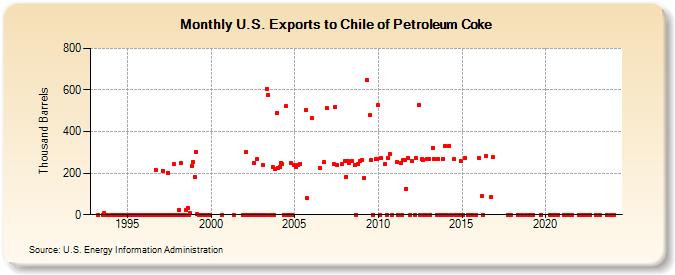
| U.S. Exports to Chile of Petroleum Coke (Thousand Barrels) | ||||||||
| Year | Jan | Feb | Mar | Apr | May | Jun | Jul | Aug | Sep | Oct | Nov | Dec |
|---|---|---|---|---|---|---|---|---|---|---|---|---|
| 1993 | 0 | 0 | 6 | 0 | 0 | |||||||
| 1994 | 0 | 0 | 0 | 0 | 0 | 0 | 0 | 0 | 0 | 0 | 0 | 0 |
| 1995 | 0 | 0 | 0 | 0 | 0 | 0 | 0 | 1 | 0 | 0 | 0 | 0 |
| 1996 | 0 | 0 | 0 | 0 | 0 | 0 | 0 | 0 | 216 | 0 | 0 | 0 |
| 1997 | 0 | 212 | 0 | 0 | 0 | 200 | 0 | 1 | 0 | 242 | 0 | 0 |
| 1998 | 0 | 24 | 248 | 0 | 0 | 0 | 25 | 33 | 0 | 7 | 235 | 255 |
| 1999 | 181 | 303 | 3 | 0 | 0 | 0 | 0 | 0 | 0 | 0 | 0 | 0 |
| 2000 | 0 | |||||||||||
| 2001 | 0 | 0 | ||||||||||
| 2002 | 0 | 303 | 0 | 0 | 0 | 0 | 0 | 249 | 0 | 269 | 0 | 0 |
| 2003 | 0 | 241 | 0 | 0 | 606 | 576 | 0 | 1 | 230 | 0 | 220 | 491 |
| 2004 | 224 | 229 | 250 | 242 | 0 | 0 | 521 | 0 | 0 | 247 | 0 | 237 |
| 2005 | 231 | 241 | 246 | 506 | 79 | |||||||
| 2006 | 463 | 226 | 252 | 511 | ||||||||
| 2007 | 246 | 520 | 238 | 243 | ||||||||
| 2008 | 259 | 182 | 260 | 248 | 259 | 239 | 0 | 245 | 260 | |||
| 2009 | 263 | 178 | 647 | 479 | 263 | 0 | 266 | 269 | ||||
| 2010 | 526 | 0 | 272 | 243 | 0 | 274 | 294 | 0 | ||||
| 2011 | 253 | 0 | 247 | 0 | 264 | 261 | 125 | 273 | 0 | |||
| 2012 | 259 | 0 | 271 | 526 | 0 | 267 | 264 | 1 | 0 | 270 | ||
| 2013 | 270 | 0 | 323 | 268 | 0 | 266 | 0 | 0 | 270 | 1 | ||
| 2014 | 332 | 0 | 331 | 0 | 269 | 0 | 0 | 0 | 0 | 260 | ||
| 2015 | 1 | 0 | 273 | 0 | 1 | 0 | 0 | |||||
| 2016 | 274 | 91 | 0 | 282 | 83 | 276 | ||||||
| 2017 | 0 | 0 | 1 | |||||||||
| 2018 | 0 | 1 | 0 | |||||||||
| 2019 | 0 | 1 | 1 | 1 | ||||||||
| 2020 | 0 | 0 | 0 | 1 | 0 | |||||||
| 2021 | 0 | 0 | 1 | 0 | 0 | 1 | 0 | |||||
| 2022 | 0 | 0 | 0 | 1 | 0 | 1 | ||||||
| 2023 | 0 | 0 | 0 | 0 | ||||||||
| - = No Data Reported; -- = Not Applicable; NA = Not Available; W = Withheld to avoid disclosure of individual company data. |
| Release Date: 3/29/2024 |
| Next Release Date: 4/30/2024 |