|
Download Data (XLS File) |
|
||||||||
|
||||||||
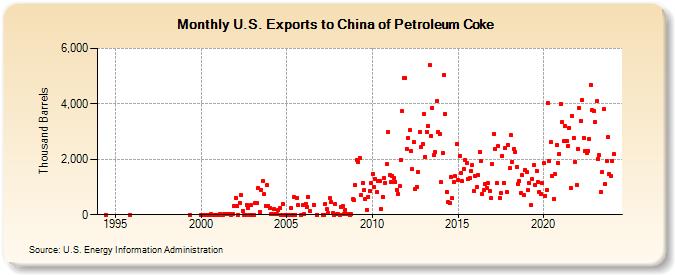
| U.S. Exports to China of Petroleum Coke (Thousand Barrels) | ||||||||
| Year | Jan | Feb | Mar | Apr | May | Jun | Jul | Aug | Sep | Oct | Nov | Dec |
|---|---|---|---|---|---|---|---|---|---|---|---|---|
| 1994 | 2 | |||||||||||
| 1995 | 0 | |||||||||||
| 1999 | 0 | |||||||||||
| 2000 | 0 | 0 | 0 | 0 | 0 | 0 | 0 | 16 | 0 | 0 | 0 | 0 |
| 2001 | 0 | 33 | 0 | 0 | 8 | 18 | 18 | 18 | 21 | 0 | 23 | 331 |
| 2002 | 620 | 309 | 0 | 434 | 699 | 143 | 0 | 0 | 364 | 242 | 0 | 336 |
| 2003 | 0 | 0 | 411 | 410 | 963 | 99 | 907 | 1,212 | 736 | 326 | 1,054 | 324 |
| 2004 | 251 | 8 | 8 | 192 | 10 | 11 | 155 | 227 | 0 | 397 | 0 | 0 |
| 2005 | 1 | 0 | 0 | 248 | 0 | 646 | 1 | 613 | 349 | 1 | 336 | |
| 2006 | 17 | 396 | 273 | 649 | 119 | 364 | 0 | |||||
| 2007 | 0 | 0 | 393 | 192 | 54 | 587 | 450 | 47 | 6 | 391 | 10 | |
| 2008 | 10 | 5 | 285 | 312 | 8 | 179 | 19 | 12 | 6 | 13 | 553 | 534 |
| 2009 | 1,068 | 1,979 | 1,902 | 2,062 | 698 | 1,156 | 882 | 557 | 179 | 653 | 854 | 1,162 |
| 2010 | 1,484 | 1,003 | 1,295 | 825 | 1,201 | 1,222 | 197 | 651 | 1,327 | 1,162 | 1,819 | 2,971 |
| 2011 | 1,425 | 1,179 | 1,403 | 1,329 | 1,196 | 898 | 741 | 1,026 | 1,983 | 3,731 | 4,932 | 4,926 |
| 2012 | 2,371 | 2,780 | 3,039 | 2,295 | 1,654 | 2,617 | 923 | 1,011 | 1,548 | 2,966 | 2,425 | 2,550 |
| 2013 | 3,636 | 2,099 | 2,998 | 3,202 | 5,397 | 2,853 | 3,857 | 2,137 | 2,255 | 4,095 | 2,999 | 2,905 |
| 2014 | 1,168 | 2,234 | 5,049 | 3,628 | 826 | 451 | 408 | 1,357 | 587 | 1,194 | 1,384 | 2,559 |
| 2015 | 1,251 | 2,133 | 1,501 | 1,202 | 1,647 | 1,967 | 1,863 | 1,277 | 1,315 | 1,571 | 1,777 | 853 |
| 2016 | 1,393 | 995 | 1,422 | 2,271 | 1,929 | 741 | 909 | 1,124 | 964 | 1,130 | 868 | 592 |
| 2017 | 1,814 | 2,929 | 2,379 | 1,128 | 2,468 | 617 | 770 | 2,132 | 1,156 | 2,403 | 802 | 2,517 |
| 2018 | 1,675 | 2,859 | 1,918 | 2,377 | 2,256 | 1,723 | 1,107 | 1,216 | 782 | 1,416 | 710 | 1,618 |
| 2019 | 1,538 | 889 | 1,138 | 348 | 1,273 | 1,792 | 1,062 | 1,586 | 1,179 | 827 | 761 | 1,142 |
| 2020 | 1,848 | 684 | 882 | 4,014 | 1,927 | 2,609 | 1,408 | 580 | 1,456 | 2,524 | 1,878 | 2,192 |
| 2021 | 3,999 | 3,336 | 2,642 | 3,203 | 2,657 | 2,479 | 3,143 | 963 | 3,549 | 2,779 | 1,908 | 1,084 |
| 2022 | 2,382 | 3,854 | 3,391 | 4,134 | 2,782 | 2,307 | 2,226 | 2,314 | 2,731 | 4,694 | 3,781 | 3,752 |
| 2023 | 3,346 | 4,091 | 2,025 | 2,137 | 829 | 1,535 | 3,804 | 1,122 | 1,942 | 2,786 | 1,461 | 1,395 |
| 2024 | 1,948 | |||||||||||
| - = No Data Reported; -- = Not Applicable; NA = Not Available; W = Withheld to avoid disclosure of individual company data. |
| Release Date: 3/29/2024 |
| Next Release Date: 4/30/2024 |