|
Download Data (XLS File) |
|
||||||||
|
||||||||
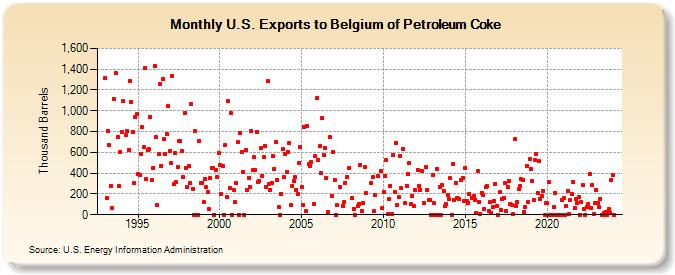
| U.S. Exports to Belgium of Petroleum Coke (Thousand Barrels) | ||||||||
| Year | Jan | Feb | Mar | Apr | May | Jun | Jul | Aug | Sep | Oct | Nov | Dec |
|---|---|---|---|---|---|---|---|---|---|---|---|---|
| 1993 | 1,315 | 158 | 806 | 668 | 277 | 60 | 1,117 | 1,360 | 751 | 276 | 607 | |
| 1994 | 800 | 1,094 | 765 | 809 | 627 | 1,289 | 1,085 | 799 | 302 | 939 | 965 | |
| 1995 | 387 | 384 | 584 | 843 | 651 | 1,409 | 344 | 622 | 630 | 940 | 330 | 452 |
| 1996 | 1,432 | 743 | 89 | 584 | 1,261 | 472 | 1,306 | 732 | 581 | 781 | 1,042 | 610 |
| 1997 | 502 | 1,335 | 291 | 593 | 312 | 463 | 709 | 708 | 617 | 358 | 974 | 453 |
| 1998 | 265 | 465 | 303 | 1,065 | 251 | 0 | 802 | 0 | 0 | 713 | 306 | 308 |
| 1999 | 121 | 347 | 262 | 220 | 55 | 354 | 453 | 451 | 0 | 429 | 362 | 590 |
| 2000 | 474 | 196 | 468 | 0 | 670 | 173 | 1,094 | 254 | 975 | 0 | 239 | 124 |
| 2001 | 305 | 695 | 0 | 785 | 601 | 414 | 0 | 626 | 241 | 357 | 268 | 803 |
| 2002 | 429 | 551 | 432 | 800 | 315 | 323 | 638 | 373 | 555 | 661 | 269 | 1,283 |
| 2003 | 295 | 242 | 308 | 563 | 443 | 701 | 334 | 76 | 0 | 203 | 628 | 360 |
| 2004 | 587 | 409 | 605 | 687 | 92 | 277 | 320 | 362 | 241 | 203 | 500 | 649 |
| 2005 | 264 | 89 | 840 | 37 | 851 | 484 | 468 | 503 | 106 | 568 | 1,121 | |
| 2006 | 531 | 658 | 402 | 928 | 573 | 643 | 357 | 23 | 743 | 182 | 606 | |
| 2007 | 335 | 2 | 92 | 263 | 85 | 126 | 308 | 362 | 452 | |||
| 2008 | 158 | 53 | 0 | 80 | 105 | 481 | 39 | 117 | 460 | 210 | ||
| 2009 | 309 | 362 | 33 | 190 | 368 | 418 | 63 | |||||
| 2010 | 220 | 373 | 523 | 4 | 153 | 278 | 5 | 573 | 215 | 689 | 94 | 167 |
| 2011 | 568 | 254 | 636 | 116 | 277 | 388 | 494 | 100 | 182 | 81 | 240 | |
| 2012 | 433 | 280 | 233 | 424 | 110 | 458 | 239 | 144 | 139 | 2 | ||
| 2013 | 383 | 116 | 1 | 438 | 2 | 266 | 1 | 283 | 230 | 83 | 102 | 194 |
| 2014 | 154 | 349 | 2 | 484 | 144 | 309 | 165 | 149 | 332 | 354 | 129 | |
| 2015 | 451 | 132 | 116 | 203 | 165 | 176 | 145 | 17 | 420 | 125 | 6 | |
| 2016 | 213 | 189 | 55 | 264 | 272 | 35 | 119 | 12 | 71 | 132 | 295 | 83 |
| 2017 | 0 | 215 | 44 | 147 | 165 | 304 | 33 | 267 | 326 | 107 | 95 | 11 |
| 2018 | 725 | 85 | 121 | 248 | 274 | 340 | 337 | 25 | 74 | 472 | 125 | 539 |
| 2019 | 438 | 329 | 139 | 530 | 580 | 211 | 514 | 154 | 179 | 232 | 0 | 111 |
| 2020 | 108 | 312 | 1 | 2 | 0 | 73 | 213 | 1 | 1 | 2 | 2 | 139 |
| 2021 | 156 | 1 | 84 | 227 | 3 | 141 | 195 | 317 | 61 | 155 | 111 | 166 |
| 2022 | 1 | 120 | 284 | 58 | 0 | 72 | 104 | 394 | 67 | 288 | 3 | 111 |
| 2023 | 242 | 115 | 73 | 149 | 0 | 1 | 14 | 29 | 0 | 55 | 15 | 331 |
| 2024 | 381 | |||||||||||
| - = No Data Reported; -- = Not Applicable; NA = Not Available; W = Withheld to avoid disclosure of individual company data. |
| Release Date: 3/29/2024 |
| Next Release Date: 4/30/2024 |