|
Download Data (XLS File) |
|
||||||||
|
||||||||
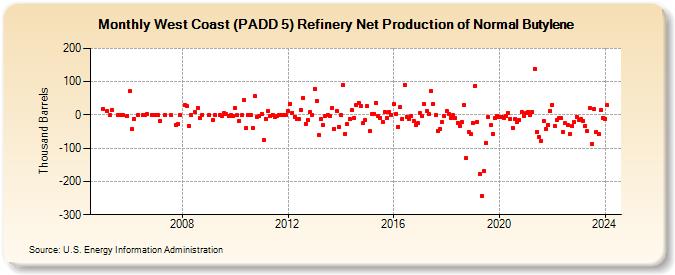
| West Coast (PADD 5) Refinery Net Production of Normal Butylene (Thousand Barrels) | ||||||||
| Year | Jan | Feb | Mar | Apr | May | Jun | Jul | Aug | Sep | Oct | Nov | Dec |
|---|---|---|---|---|---|---|---|---|---|---|---|---|
| 2005 | 18 | 11 | -1 | 15 | 1 | -1 | 1 | -2 | ||||
| 2006 | 71 | -43 | -13 | 1 | -1 | -1 | 2 | 1 | -1 | |||
| 2007 | -1 | -1 | -18 | -1 | -1 | -29 | -27 | -1 | ||||
| 2008 | 30 | 26 | -32 | 1 | 8 | 22 | -9 | 1 | ||||
| 2009 | -1 | -14 | -1 | 0 | -3 | 6 | 2 | -3 | 0 | -3 | ||
| 2010 | 22 | -1 | -18 | -1 | 44 | -38 | 0 | 1 | -40 | 56 | -6 | -2 |
| 2011 | 3 | -76 | -11 | 12 | -2 | 1 | -6 | -4 | 0 | 1 | -1 | 0 |
| 2012 | 11 | 34 | 7 | -6 | -13 | -13 | 15 | 51 | -27 | -14 | 9 | 1 |
| 2013 | 78 | 43 | -61 | -13 | -30 | -3 | 0 | -2 | 21 | -41 | 13 | -35 |
| 2014 | 0 | 90 | -56 | -28 | -13 | 14 | -10 | 29 | 37 | 27 | -24 | -15 |
| 2015 | 26 | -49 | 3 | 4 | 36 | -4 | -8 | -20 | 8 | -9 | 9 | 1 |
| 2016 | 32 | 3 | -35 | 23 | -12 | 91 | -5 | -12 | -3 | -17 | -30 | -25 |
| 2017 | 5 | -4 | 32 | 12 | 2 | 71 | 34 | 0 | -48 | -42 | -22 | -3 |
| 2018 | 11 | 4 | -8 | -1 | -8 | -23 | -32 | -22 | 30 | -130 | -51 | -58 |
| 2019 | -23 | 88 | -20 | -177 | -243 | -170 | -83 | -7 | -31 | -57 | -8 | -3 |
| 2020 | -5 | -6 | -10 | -2 | 7 | -12 | -38 | -12 | -20 | -14 | 10 | -4 |
| 2021 | 5 | 9 | 1 | 9 | 139 | -50 | -66 | -77 | -19 | -43 | -30 | 12 |
| 2022 | 31 | -32 | -16 | -9 | -9 | -50 | -25 | -31 | -57 | -32 | -22 | -5 |
| 2023 | -14 | -12 | -17 | -33 | -49 | 20 | -87 | 18 | -50 | -58 | 14 | -9 |
| 2024 | -11 | |||||||||||
| - = No Data Reported; -- = Not Applicable; NA = Not Available; W = Withheld to avoid disclosure of individual company data. |
| Release Date: 3/29/2024 |
| Next Release Date: 4/30/2024 |
Referring Pages: