|
Download Data (XLS File) |
|
||||||||
|
||||||||
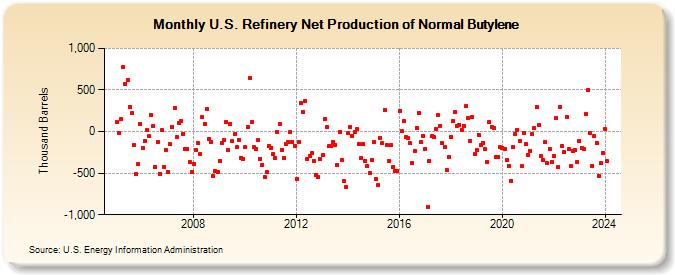
| U.S. Refinery Net Production of Normal Butylene (Thousand Barrels) | ||||||||
| Year | Jan | Feb | Mar | Apr | May | Jun | Jul | Aug | Sep | Oct | Nov | Dec |
|---|---|---|---|---|---|---|---|---|---|---|---|---|
| 2005 | 110 | -18 | 147 | 778 | 572 | 617 | 299 | 223 | -161 | -512 | -396 | 92 |
| 2006 | -199 | -111 | 14 | -59 | 199 | 65 | -429 | -124 | -509 | 14 | -426 | -226 |
| 2007 | -483 | -154 | 60 | 288 | -69 | 102 | 127 | -25 | -211 | -208 | -372 | -485 |
| 2008 | -387 | -226 | -143 | -267 | 170 | 88 | 270 | -93 | -130 | -533 | -473 | -481 |
| 2009 | -349 | -137 | -101 | 116 | -224 | 96 | -116 | -34 | -186 | -99 | -315 | -328 |
| 2010 | -189 | 54 | 645 | 113 | -183 | -210 | -105 | -325 | -399 | -549 | -491 | -174 |
| 2011 | -193 | -271 | -321 | -3 | 92 | -218 | -320 | -150 | -124 | -10 | -121 | -175 |
| 2012 | -573 | -121 | 343 | 238 | 368 | -333 | -291 | -263 | -350 | -526 | -547 | -330 |
| 2013 | -277 | 146 | 56 | -177 | -168 | -120 | -156 | -402 | -5 | -347 | -598 | -667 |
| 2014 | -23 | 51 | -52 | -6 | 32 | -154 | -323 | -155 | -350 | -417 | -499 | -345 |
| 2015 | -126 | -571 | -645 | -76 | -142 | 258 | -161 | -353 | -159 | -422 | -475 | -473 |
| 2016 | 247 | 3 | 122 | -66 | -82 | -143 | -376 | -235 | 43 | 227 | -127 | -48 |
| 2017 | -212 | -902 | -354 | -59 | -65 | 29 | 199 | 71 | -141 | -191 | -461 | -311 |
| 2018 | -65 | 130 | 239 | 71 | 83 | 16 | 71 | 304 | 162 | -113 | 175 | -271 |
| 2019 | -224 | -41 | -165 | -132 | -210 | -364 | 114 | 56 | 39 | -308 | -303 | -189 |
| 2020 | -194 | -209 | -344 | -411 | -589 | -188 | -27 | 24 | -113 | -419 | -13 | -152 |
| 2021 | -284 | -229 | -26 | 44 | 296 | 77 | -291 | -337 | -131 | -384 | -204 | -363 |
| 2022 | -296 | 157 | -429 | 298 | -171 | -247 | 176 | -215 | -418 | -235 | -221 | -368 |
| 2023 | -116 | -193 | -213 | 212 | 500 | -12 | -411 | -52 | -137 | -529 | -383 | -252 |
| 2024 | 32 | -355 | ||||||||||
| - = No Data Reported; -- = Not Applicable; NA = Not Available; W = Withheld to avoid disclosure of individual company data. |
| Release Date: 4/30/2024 |
| Next Release Date: 5/31/2024 |
Referring Pages: