|
Download Data (XLS File) |
|
||||||||
|
||||||||
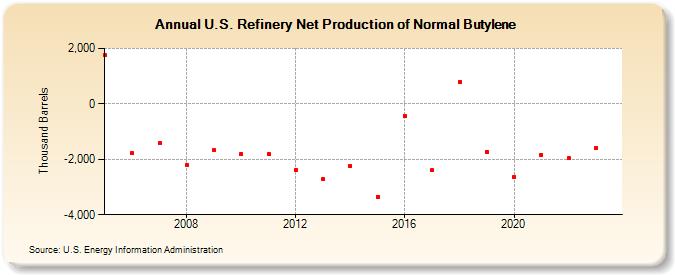
| U.S. Refinery Net Production of Normal Butylene (Thousand Barrels) | ||||||||
| Decade | Year-0 | Year-1 | Year-2 | Year-3 | Year-4 | Year-5 | Year-6 | Year-7 | Year-8 | Year-9 |
|---|---|---|---|---|---|---|---|---|---|---|
| 2000's | 1,751 | -1,791 | -1,430 | -2,205 | -1,677 | |||||
| 2010's | -1,813 | -1,814 | -2,385 | -2,715 | -2,241 | -3,345 | -435 | -2,397 | 802 | -1,727 |
| 2020's | -2,635 | -1,832 | -1,969 | -1,587 |
| - = No Data Reported; -- = Not Applicable; NA = Not Available; W = Withheld to avoid disclosure of individual company data. |
| Release Date: 8/30/2024 |
| Next Release Date: 8/29/2025 |
Referring Pages: