|
Download Data (XLS File) |
|
||||||||
|
||||||||
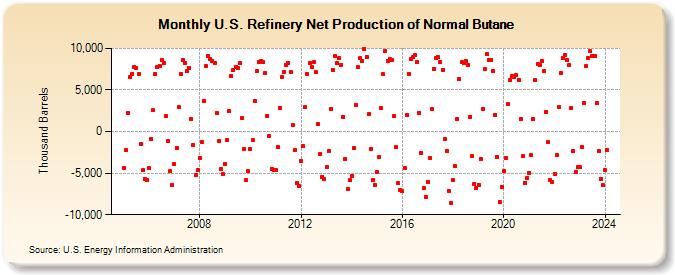
| U.S. Refinery Net Production of Normal Butane (Thousand Barrels) | ||||||||
| Year | Jan | Feb | Mar | Apr | May | Jun | Jul | Aug | Sep | Oct | Nov | Dec |
|---|---|---|---|---|---|---|---|---|---|---|---|---|
| 2005 | -4,351 | -2,226 | 2,284 | 6,541 | 6,966 | 7,819 | 7,600 | 6,963 | -1,485 | -4,679 | -5,722 | -5,872 |
| 2006 | -4,377 | -948 | 2,552 | 6,893 | 7,768 | 7,923 | 8,616 | 8,194 | 1,828 | -1,162 | -4,777 | -6,412 |
| 2007 | -3,922 | -1,953 | 2,931 | 6,925 | 8,559 | 8,238 | 7,294 | 7,658 | 1,482 | -1,639 | -5,282 | -4,576 |
| 2008 | -3,193 | -1,263 | 3,652 | 7,875 | 9,101 | 8,770 | 8,477 | 8,252 | 2,274 | -1,177 | -4,516 | -5,160 |
| 2009 | -3,610 | -862 | 2,629 | 6,546 | 7,583 | 7,700 | 7,791 | 8,227 | 1,818 | -1,985 | -5,568 | -4,444 |
| 2010 | -2,124 | -1,072 | 3,654 | 7,230 | 8,338 | 8,461 | 8,312 | 7,018 | 1,913 | -570 | -4,472 | -4,594 |
| 2011 | -4,625 | -1,864 | 2,840 | 6,548 | 7,172 | 7,967 | 8,292 | 7,187 | 751 | -2,269 | -6,191 | -6,545 |
| 2012 | -3,557 | -1,749 | 2,954 | 6,900 | 8,225 | 7,703 | 8,304 | 7,159 | 890 | -2,666 | -5,439 | -5,759 |
| 2013 | -4,236 | -2,359 | 2,738 | 7,447 | 9,026 | 8,239 | 8,832 | 8,038 | 1,743 | -3,258 | -6,927 | -5,831 |
| 2014 | -5,296 | -2,005 | 3,201 | 7,754 | 8,813 | 8,537 | 9,979 | 8,953 | 2,084 | -2,092 | -5,824 | -6,451 |
| 2015 | -4,863 | -3,117 | 2,871 | 6,885 | 9,663 | 8,512 | 8,717 | 8,560 | 1,851 | -1,911 | -6,244 | -6,989 |
| 2016 | -7,198 | -4,393 | 1,945 | 6,941 | 8,737 | 8,912 | 9,172 | 8,340 | 2,191 | -2,574 | -6,798 | -7,881 |
| 2017 | -6,083 | -3,182 | 2,663 | 7,566 | 8,891 | 8,913 | 8,362 | 7,396 | -843 | -2,327 | -7,112 | -8,534 |
| 2018 | -5,858 | -4,181 | 1,511 | 6,367 | 8,333 | 8,211 | 8,462 | 8,036 | 1,803 | -2,990 | -6,266 | -6,797 |
| 2019 | -6,367 | -3,287 | 2,756 | 7,501 | 9,304 | 8,608 | 8,644 | 7,284 | 2,003 | -3,086 | -8,422 | -6,660 |
| 2020 | -4,713 | -3,208 | 3,286 | 6,170 | 6,707 | 6,559 | 6,753 | 6,251 | 1,490 | -2,971 | -6,140 | -5,580 |
| 2021 | -4,957 | -2,838 | 1,528 | 6,150 | 8,135 | 8,045 | 8,505 | 7,266 | 2,389 | -1,305 | -5,821 | -6,045 |
| 2022 | -5,050 | -2,786 | 3,007 | 6,994 | 8,851 | 9,198 | 8,641 | 7,990 | 2,863 | -2,366 | -4,893 | -4,267 |
| 2023 | -4,299 | -1,844 | 3,450 | 7,875 | 8,847 | 9,637 | 9,064 | 9,138 | 3,472 | -2,391 | -5,670 | -6,471 |
| 2024 | -4,682 | |||||||||||
| - = No Data Reported; -- = Not Applicable; NA = Not Available; W = Withheld to avoid disclosure of individual company data. |
| Release Date: 3/29/2024 |
| Next Release Date: 4/30/2024 |
Referring Pages: