|
Download Data (XLS File) |
|
||||||||
|
||||||||
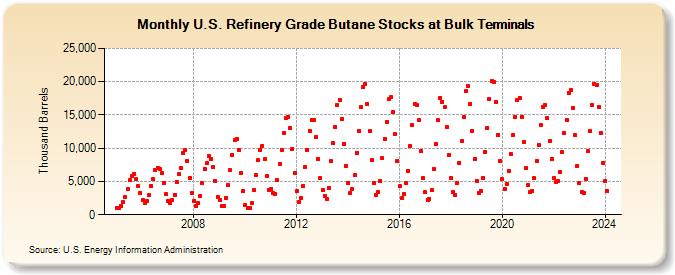
| U.S. Refinery Grade Butane Stocks at Bulk Terminals (Thousand Barrels) | ||||||||
| Year | Jan | Feb | Mar | Apr | May | Jun | Jul | Aug | Sep | Oct | Nov | Dec |
|---|---|---|---|---|---|---|---|---|---|---|---|---|
| 2005 | 1,077 | 999 | 1,362 | 1,864 | 2,663 | 3,814 | 5,150 | 5,775 | 6,176 | 5,303 | 4,272 | 3,241 |
| 2006 | 2,239 | 1,790 | 2,093 | 2,898 | 4,390 | 5,363 | 6,729 | 7,065 | 6,807 | 6,215 | 4,706 | 3,079 |
| 2007 | 2,101 | 1,812 | 2,281 | 3,019 | 4,928 | 6,120 | 7,003 | 9,316 | 9,722 | 8,097 | 5,529 | 3,212 |
| 2008 | 2,055 | 1,255 | 1,717 | 2,862 | 4,716 | 6,895 | 7,721 | 8,758 | 8,380 | 7,200 | 5,024 | 2,674 |
| 2009 | 2,248 | 1,344 | 1,349 | 2,525 | 4,446 | 6,669 | 9,020 | 11,197 | 11,447 | 9,696 | 6,314 | 3,523 |
| 2010 | 1,489 | 991 | 1,040 | 1,700 | 3,748 | 5,961 | 8,169 | 9,755 | 10,356 | 8,307 | 5,879 | 3,784 |
| 2011 | 3,895 | 3,221 | 3,185 | 5,151 | 7,594 | 9,754 | 12,307 | 14,581 | 14,755 | 13,069 | 9,891 | 6,211 |
| 2012 | 3,526 | 1,871 | 2,538 | 4,329 | 7,142 | 9,696 | 12,536 | 14,306 | 14,235 | 11,684 | 8,421 | 5,519 |
| 2013 | 3,657 | 2,876 | 2,388 | 4,057 | 8,028 | 10,724 | 13,197 | 16,458 | 17,317 | 14,425 | 10,679 | 7,379 |
| 2014 | 4,796 | 3,258 | 3,911 | 5,921 | 9,344 | 12,566 | 16,142 | 19,161 | 19,668 | 16,672 | 12,578 | 8,226 |
| 2015 | 4,812 | 2,986 | 3,386 | 5,101 | 8,485 | 11,356 | 13,985 | 17,355 | 17,643 | 15,411 | 12,094 | 8,069 |
| 2016 | 4,245 | 2,462 | 3,119 | 4,737 | 6,638 | 10,366 | 13,471 | 16,641 | 16,416 | 14,167 | 9,502 | 5,523 |
| 2017 | 3,340 | 2,266 | 2,413 | 3,667 | 6,928 | 10,554 | 14,166 | 17,597 | 16,997 | 16,147 | 13,210 | 8,914 |
| 2018 | 5,586 | 3,348 | 2,982 | 4,790 | 7,846 | 11,067 | 14,699 | 18,547 | 19,330 | 16,689 | 12,594 | 8,411 |
| 2019 | 5,075 | 3,308 | 3,544 | 5,538 | 9,450 | 13,107 | 17,395 | 20,080 | 19,968 | 16,927 | 11,961 | 8,137 |
| 2020 | 5,315 | 3,938 | 4,643 | 6,605 | 9,098 | 11,942 | 14,698 | 17,220 | 17,605 | 14,726 | 10,943 | 7,082 |
| 2021 | 4,520 | 3,486 | 3,542 | 5,467 | 8,111 | 10,444 | 13,480 | 16,176 | 16,493 | 14,487 | 11,049 | 8,449 |
| 2022 | 5,513 | 4,906 | 5,019 | 6,438 | 9,359 | 12,311 | 14,268 | 18,264 | 18,707 | 16,097 | 11,930 | 7,377 |
| 2023 | 4,815 | 3,460 | 3,333 | 5,427 | 9,586 | 12,544 | 16,519 | 19,610 | 19,519 | 16,207 | 12,278 | 7,811 |
| 2024 | 5,091 | |||||||||||
| - = No Data Reported; -- = Not Applicable; NA = Not Available; W = Withheld to avoid disclosure of individual company data. |
| Release Date: 3/29/2024 |
| Next Release Date: 4/30/2024 |