|
Download Data (XLS File) |
|
||||||||
|
||||||||
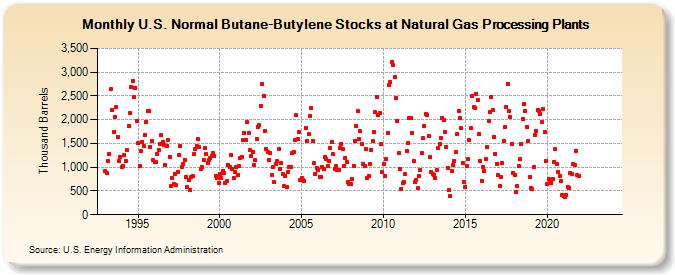
| U.S. Normal Butane-Butylene Stocks at Natural Gas Processing Plants (Thousand Barrels) | ||||||||
| Year | Jan | Feb | Mar | Apr | May | Jun | Jul | Aug | Sep | Oct | Nov | Dec |
|---|---|---|---|---|---|---|---|---|---|---|---|---|
| 1993 | 920 | 869 | 1,137 | 1,273 | 2,636 | 2,201 | 1,743 | 2,051 | 2,260 | 1,639 | 1,132 | 1,216 |
| 1994 | 1,003 | 1,031 | 1,258 | 1,135 | 1,367 | 1,870 | 2,143 | 2,682 | 2,814 | 2,476 | 2,676 | 1,967 |
| 1995 | 1,499 | 1,027 | 1,342 | 1,524 | 1,452 | 1,686 | 1,960 | 2,184 | 2,191 | 1,430 | 1,552 | 1,155 |
| 1996 | 1,102 | 1,107 | 1,275 | 1,367 | 1,483 | 1,669 | 1,521 | 1,474 | 1,043 | 1,453 | 1,582 | 1,223 |
| 1997 | 600 | 776 | 647 | 862 | 619 | 899 | 1,255 | 1,455 | 1,014 | 1,065 | 1,149 | 799 |
| 1998 | 578 | 737 | 526 | 792 | 806 | 1,277 | 1,390 | 1,441 | 1,584 | 1,417 | 957 | 1,002 |
| 1999 | 1,150 | 1,395 | 1,277 | 1,083 | 1,148 | 1,202 | 1,226 | 1,298 | 1,229 | 818 | 782 | 673 |
| 2000 | 861 | 780 | 929 | 869 | 672 | 713 | 1,055 | 1,006 | 1,261 | 972 | 774 | 904 |
| 2001 | 994 | 835 | 1,024 | 1,188 | 1,216 | 1,562 | 1,729 | 1,568 | 1,945 | 1,723 | 1,355 | 1,226 |
| 2002 | 1,320 | 1,049 | 1,150 | 1,601 | 1,856 | 1,880 | 2,285 | 2,756 | 2,496 | 1,770 | 1,390 | 1,330 |
| 2003 | 1,158 | 1,301 | 842 | 1,005 | 685 | 1,067 | 1,123 | 1,383 | 961 | 1,092 | 852 | 597 |
| 2004 | 821 | 578 | 905 | 998 | 1,010 | 1,291 | 1,318 | 1,564 | 2,089 | 1,587 | 1,739 | 730 |
| 2005 | 777 | 722 | 713 | 1,831 | 1,555 | 1,688 | 2,075 | 2,236 | 1,547 | 1,086 | 853 | 988 |
| 2006 | 949 | 797 | 792 | 1,003 | 963 | 1,214 | 1,171 | 1,027 | 1,135 | 1,394 | 1,532 | 1,269 |
| 2007 | 967 | 1,022 | 951 | 942 | 1,399 | 1,489 | 1,386 | 1,029 | 1,202 | 1,111 | 698 | 646 |
| 2008 | 652 | 751 | 1,034 | 1,559 | 1,872 | 2,174 | 1,596 | 1,755 | 1,496 | 1,072 | 1,019 | 1,373 |
| 2009 | 770 | 816 | 1,061 | 1,362 | 1,545 | 1,744 | 2,158 | 2,484 | 2,093 | 2,141 | 1,482 | 907 |
| 2010 | 1,058 | 822 | 1,162 | 1,715 | 2,730 | 2,789 | 3,217 | 3,142 | 2,888 | 2,465 | 1,979 | 1,292 |
| 2011 | 965 | 542 | 665 | 685 | 854 | 1,337 | 1,511 | 2,039 | 2,044 | 1,718 | 1,133 | 688 |
| 2012 | 729 | 554 | 810 | 951 | 1,299 | 1,605 | 1,866 | 2,119 | 2,094 | 1,656 | 1,208 | 907 |
| 2013 | 864 | 835 | 763 | 942 | 1,406 | 1,483 | 1,616 | 2,040 | 2,003 | 1,738 | 1,427 | 992 |
| 2014 | 514 | 391 | 920 | 1,050 | 1,138 | 1,323 | 1,700 | 2,193 | 2,033 | 1,819 | 1,089 | 678 |
| 2015 | 577 | 1,020 | 1,166 | 1,569 | 1,816 | 2,493 | 2,264 | 2,248 | 2,535 | 2,410 | 1,696 | 1,134 |
| 2016 | 713 | 1,002 | 929 | 1,167 | 1,428 | 1,967 | 2,159 | 2,486 | 2,204 | 1,643 | 1,276 | 1,075 |
| 2017 | 826 | 602 | 787 | 1,097 | 1,543 | 1,845 | 2,269 | 2,749 | 2,185 | 2,049 | 1,483 | 871 |
| 2018 | 832 | 474 | 597 | 1,017 | 1,166 | 1,496 | 2,006 | 2,339 | 2,192 | 1,852 | 1,547 | 795 |
| 2019 | 556 | 532 | 1,003 | 1,682 | 1,755 | 2,207 | 2,173 | 2,113 | 1,942 | 2,220 | 1,738 | 1,129 |
| 2020 | 651 | 755 | 714 | 673 | 756 | 1,118 | 1,376 | 1,063 | 905 | 805 | 714 | 416 |
| 2021 | 394 | 366 | 422 | 585 | 557 | 883 | 862 | 1,060 | 1,041 | 1,348 | 831 | 824 |
| 2022 | -- | -- | -- | -- | -- | -- | -- | -- | -- | -- | -- | -- |
| 2023 | -- | -- | -- | -- | -- | -- | -- | -- | -- | -- | -- | -- |
| 2024 | -- | |||||||||||
| - = No Data Reported; -- = Not Applicable; NA = Not Available; W = Withheld to avoid disclosure of individual company data. |
| Release Date: 3/29/2024 |
| Next Release Date: 4/30/2024 |