|
Download Data (XLS File) |
|
||||||||
|
||||||||
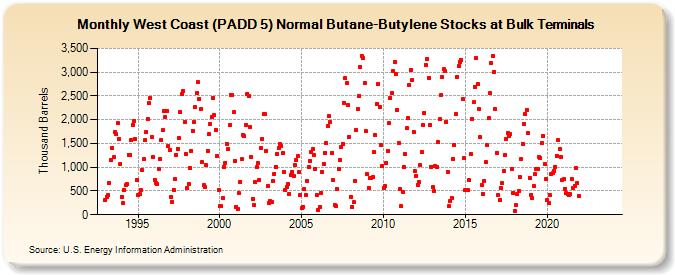
| West Coast (PADD 5) Normal Butane-Butylene Stocks at Bulk Terminals (Thousand Barrels) | ||||||||
| Year | Jan | Feb | Mar | Apr | May | Jun | Jul | Aug | Sep | Oct | Nov | Dec |
|---|---|---|---|---|---|---|---|---|---|---|---|---|
| 1993 | 312 | 381 | 415 | 676 | 1,152 | 1,406 | 1,207 | 1,732 | 1,690 | 1,925 | 1,594 | 1,077 |
| 1994 | 383 | 244 | 513 | 615 | 641 | 1,266 | 1,255 | 1,572 | 1,889 | 1,974 | 1,594 | 729 |
| 1995 | 417 | 427 | 510 | 945 | 1,166 | 1,566 | 1,748 | 2,005 | 2,343 | 2,452 | 1,644 | 1,214 |
| 1996 | 728 | 672 | 646 | 956 | 1,171 | 1,576 | 1,774 | 2,185 | 2,047 | 2,178 | 1,444 | 1,363 |
| 1997 | 372 | 271 | 527 | 751 | 1,265 | 1,384 | 1,605 | 2,161 | 2,533 | 2,593 | 1,955 | 1,282 |
| 1998 | 564 | 642 | 989 | 1,342 | 1,770 | 1,948 | 2,257 | 2,566 | 2,783 | 2,432 | 2,222 | 1,105 |
| 1999 | 617 | 577 | 1,042 | 1,344 | 1,689 | 1,916 | 2,056 | 2,463 | 2,091 | 1,780 | 1,236 | 530 |
| 2000 | 188 | 174 | 353 | 1,002 | 1,094 | 1,496 | 1,378 | 1,885 | 2,523 | 2,521 | 2,151 | 1,139 |
| 2001 | 165 | 122 | 447 | 694 | 1,165 | 1,687 | 1,652 | 1,893 | 2,540 | 2,499 | 1,849 | 1,213 |
| 2002 | 331 | 201 | 697 | 994 | 1,088 | 739 | 1,402 | 1,601 | 2,123 | 2,109 | 1,343 | 605 |
| 2003 | 245 | 287 | 273 | 702 | 867 | 1,009 | 1,278 | 1,403 | 1,488 | 1,446 | 1,295 | 907 |
| 2004 | 524 | 581 | 640 | 443 | 839 | 905 | 822 | 1,051 | 1,149 | 1,229 | 889 | 420 |
| 2005 | 135 | 171 | 540 | 417 | 712 | 1,003 | 1,140 | 1,317 | 1,373 | 1,250 | 968 | 419 |
| 2006 | 100 | 155 | 460 | 909 | 1,070 | 1,301 | 1,503 | 1,869 | 2,081 | 1,943 | 1,307 | 721 |
| 2007 | 214 | 182 | 534 | 970 | 1,156 | 1,432 | 1,492 | 2,357 | 2,868 | 2,777 | 2,301 | 1,642 |
| 2008 | 374 | 165 | 261 | 711 | 1,784 | 2,218 | 2,507 | 3,107 | 3,348 | 3,295 | 2,780 | 1,754 |
| 2009 | 847 | 572 | 771 | 781 | 786 | 1,328 | 1,670 | 2,338 | 2,748 | 2,266 | 1,472 | 1,027 |
| 2010 | 570 | 602 | 1,091 | 1,349 | 1,928 | 2,465 | 2,556 | 3,031 | 3,222 | 2,970 | 2,203 | 1,501 |
| 2011 | 535 | 178 | 473 | 1,009 | 1,276 | 1,819 | 2,040 | 2,720 | 3,044 | 2,831 | 1,744 | 914 |
| 2012 | 821 | 632 | 694 | 1,036 | 1,327 | 1,889 | 2,148 | 3,150 | 3,274 | 2,880 | 1,894 | 1,013 |
| 2013 | 581 | 490 | 1,030 | 997 | 1,526 | 2,005 | 2,511 | 2,900 | 3,059 | 3,019 | 1,958 | 906 |
| 2014 | 178 | 293 | 361 | 1,172 | 1,465 | 2,121 | 2,907 | 3,127 | 3,222 | 3,259 | 2,428 | 1,186 |
| 2015 | 523 | 511 | 512 | 727 | 1,279 | 2,019 | 2,366 | 2,688 | 3,299 | 2,745 | 2,216 | 1,627 |
| 2016 | 623 | 446 | 709 | 1,105 | 1,458 | 2,028 | 2,552 | 3,194 | 3,349 | 3,009 | 2,215 | 1,304 |
| 2017 | 411 | 305 | 567 | 659 | 913 | 1,267 | 1,600 | 1,716 | 1,656 | 1,690 | 969 | 467 |
| 2018 | 88 | 198 | 437 | 496 | 793 | 1,173 | 1,495 | 1,913 | 2,119 | 2,212 | 1,710 | 779 |
| 2019 | 415 | 342 | 609 | 851 | 953 | 953 | 1,217 | 1,195 | 1,502 | 1,664 | 1,070 | 745 |
| 2020 | 307 | 250 | 412 | 848 | 877 | 921 | 1,008 | 1,241 | 1,565 | 1,384 | 1,219 | 734 |
| 2021 | 742 | 549 | 453 | 426 | 422 | 426 | 761 | 561 | 612 | 973 | 676 | 390 |
| 2022 | -- | -- | -- | -- | -- | -- | -- | -- | -- | -- | -- | -- |
| 2023 | -- | -- | -- | -- | -- | -- | -- | -- | -- | -- | -- | -- |
| 2024 | -- | |||||||||||
| - = No Data Reported; -- = Not Applicable; NA = Not Available; W = Withheld to avoid disclosure of individual company data. |
| Release Date: 3/29/2024 |
| Next Release Date: 4/30/2024 |