|
Download Data (XLS File) |
|
||||||||
|
||||||||
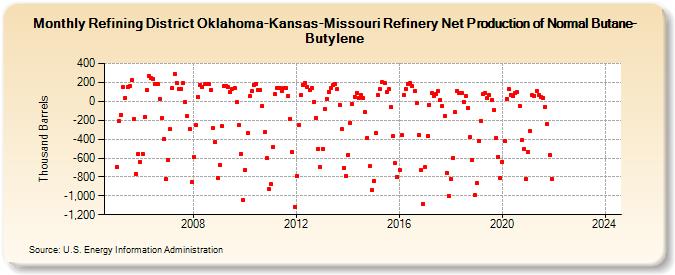
| Refining District Oklahoma-Kansas-Missouri Refinery Net Production of Normal Butane-Butylene (Thousand Barrels) | ||||||||
| Year | Jan | Feb | Mar | Apr | May | Jun | Jul | Aug | Sep | Oct | Nov | Dec |
|---|---|---|---|---|---|---|---|---|---|---|---|---|
| 2005 | -696 | -206 | -140 | 155 | 39 | 153 | 163 | 220 | -190 | -766 | -555 | -640 |
| 2006 | -554 | -165 | 117 | 268 | 242 | 236 | 188 | 186 | 25 | -176 | -400 | -826 |
| 2007 | -626 | -295 | 139 | 294 | 197 | 128 | 132 | 189 | -6 | -160 | -292 | -856 |
| 2008 | -586 | -254 | 48 | 174 | 155 | 178 | 180 | 180 | 120 | -281 | -431 | -810 |
| 2009 | -672 | -264 | 158 | 165 | 149 | 95 | 135 | 145 | -11 | -256 | -555 | -1,049 |
| 2010 | -722 | -339 | 53 | 105 | 173 | 187 | 121 | 119 | -49 | -330 | -600 | -930 |
| 2011 | -877 | -483 | 74 | 137 | 136 | 110 | 143 | 139 | 53 | -184 | -537 | -1,115 |
| 2012 | -787 | -247 | 63 | 172 | 194 | 153 | 121 | 141 | -3 | -174 | -506 | -699 |
| 2013 | -500 | -83 | 27 | 99 | 144 | 170 | 188 | 129 | -35 | -297 | -705 | -788 |
| 2014 | -567 | -226 | -30 | 50 | 92 | 35 | 71 | 32 | -114 | -386 | -688 | -940 |
| 2015 | -842 | -339 | 62 | 127 | 201 | 196 | 103 | 125 | -58 | -370 | -656 | -799 |
| 2016 | -722 | -361 | 63 | 129 | 184 | 195 | 159 | 108 | -13 | -358 | -727 | -1,086 |
| 2017 | -698 | -365 | -34 | 83 | 61 | 78 | 106 | 16 | -47 | -156 | -755 | -997 |
| 2018 | -823 | -595 | -115 | 112 | 87 | 83 | -4 | 56 | -71 | -383 | -622 | -991 |
| 2019 | -868 | -415 | -205 | 76 | 88 | 31 | 66 | 15 | -89 | -391 | -586 | -816 |
| 2020 | -638 | -422 | 26 | 129 | 70 | 56 | 89 | 95 | -46 | -412 | -503 | -821 |
| 2021 | -537 | -313 | 63 | 60 | 110 | 62 | 48 | 40 | -57 | -238 | -569 | -817 |
| 2022 | -- | -- | -- | -- | -- | -- | -- | -- | -- | -- | -- | -- |
| 2023 | -- | -- | -- | -- | -- | -- | -- | -- | -- | -- | -- | -- |
| 2024 | -- | |||||||||||
| - = No Data Reported; -- = Not Applicable; NA = Not Available; W = Withheld to avoid disclosure of individual company data. |
| Release Date: 3/29/2024 |
| Next Release Date: 4/30/2024 |