|
Download Data (XLS File) |
|
||||||||
|
||||||||
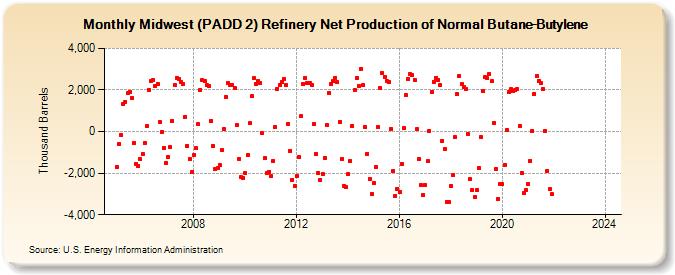
| Midwest (PADD 2) Refinery Net Production of Normal Butane-Butylene (Thousand Barrels) | ||||||||
| Year | Jan | Feb | Mar | Apr | May | Jun | Jul | Aug | Sep | Oct | Nov | Dec |
|---|---|---|---|---|---|---|---|---|---|---|---|---|
| 2005 | -1,695 | -580 | -169 | 1,312 | 1,440 | 1,845 | 1,917 | 1,624 | -537 | -1,567 | -1,641 | -1,331 |
| 2006 | -1,066 | -542 | 254 | 2,017 | 2,421 | 2,472 | 2,204 | 2,294 | 461 | -16 | -799 | -1,503 |
| 2007 | -1,211 | -758 | 527 | 2,224 | 2,580 | 2,512 | 2,374 | 2,280 | 704 | -678 | -1,317 | -1,955 |
| 2008 | -1,108 | -813 | 350 | 2,001 | 2,468 | 2,431 | 2,217 | 2,193 | 529 | -699 | -1,820 | -1,765 |
| 2009 | -1,632 | -885 | 128 | 1,681 | 2,352 | 2,233 | 2,237 | 2,080 | 311 | -1,304 | -2,190 | -2,211 |
| 2010 | -2,006 | -1,136 | 388 | 1,697 | 2,557 | 2,298 | 2,440 | 2,335 | -86 | -1,279 | -2,003 | -1,924 |
| 2011 | -2,154 | -1,395 | 231 | 2,047 | 2,228 | 2,375 | 2,530 | 2,230 | 367 | -920 | -2,319 | -2,627 |
| 2012 | -2,151 | -1,208 | 730 | 2,301 | 2,578 | 2,327 | 2,340 | 2,251 | 375 | -1,056 | -1,997 | -2,309 |
| 2013 | -2,031 | -1,274 | 293 | 1,874 | 2,306 | 2,410 | 2,579 | 2,370 | 475 | -1,297 | -2,600 | -2,674 |
| 2014 | -2,053 | -1,409 | 283 | 2,015 | 2,574 | 2,199 | 3,013 | 2,230 | 209 | -1,066 | -2,294 | -2,990 |
| 2015 | -2,477 | -1,725 | 226 | 2,090 | 2,817 | 2,640 | 2,448 | 2,406 | 123 | -1,895 | -3,110 | -2,741 |
| 2016 | -2,920 | -1,550 | 159 | 1,746 | 2,528 | 2,762 | 2,720 | 2,502 | 111 | -1,323 | -2,567 | -3,050 |
| 2017 | -2,581 | -1,416 | 40 | 1,921 | 2,406 | 2,595 | 2,485 | 2,220 | -432 | -849 | -3,383 | -3,403 |
| 2018 | -2,619 | -2,095 | -271 | 1,800 | 2,687 | 2,283 | 2,128 | 2,023 | -103 | -2,283 | -2,822 | -3,153 |
| 2019 | -2,808 | -1,744 | -252 | 1,933 | 2,621 | 2,553 | 2,770 | 2,423 | 432 | -1,794 | -3,231 | -2,499 |
| 2020 | -2,546 | -1,589 | 72 | 1,911 | 2,027 | 1,951 | 1,977 | 2,042 | 274 | -2,003 | -2,966 | -2,833 |
| 2021 | -2,520 | -1,400 | 44 | 1,826 | 2,662 | 2,450 | 2,347 | 2,054 | 29 | -1,875 | -2,778 | -3,011 |
| 2022 | -- | -- | -- | -- | -- | -- | -- | -- | -- | -- | -- | -- |
| 2023 | -- | -- | -- | -- | -- | -- | -- | -- | -- | -- | -- | -- |
| 2024 | -- | -- | -- | -- | -- | -- | ||||||
| - = No Data Reported; -- = Not Applicable; NA = Not Available; W = Withheld to avoid disclosure of individual company data. |
| Release Date: 8/30/2024 |
| Next Release Date: 9/30/2024 |