|
Download Data (XLS File) |
|
||||||||
|
||||||||
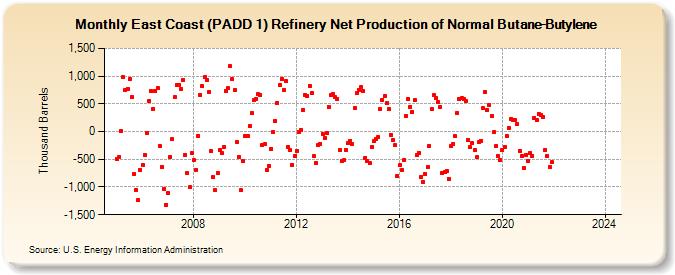
| East Coast (PADD 1) Refinery Net Production of Normal Butane-Butylene (Thousand Barrels) | ||||||||
| Year | Jan | Feb | Mar | Apr | May | Jun | Jul | Aug | Sep | Oct | Nov | Dec |
|---|---|---|---|---|---|---|---|---|---|---|---|---|
| 2005 | -497 | -455 | 11 | 981 | 745 | 776 | 941 | 620 | -758 | -1,051 | -1,233 | -692 |
| 2006 | -607 | -424 | -21 | 558 | 728 | 415 | 723 | 786 | -258 | -633 | -1,029 | -1,317 |
| 2007 | -1,105 | -451 | -142 | 619 | 843 | 846 | 774 | 935 | -418 | -754 | -1,007 | -393 |
| 2008 | -520 | -687 | -73 | 666 | 814 | 981 | 929 | 711 | -356 | -824 | -1,058 | -750 |
| 2009 | -341 | -391 | -271 | 729 | 781 | 1,175 | 940 | 747 | -195 | -451 | -1,060 | -540 |
| 2010 | -89 | -89 | 100 | 333 | 567 | 584 | 669 | 668 | -240 | -231 | -691 | -621 |
| 2011 | -307 | -9 | 196 | 524 | 836 | 951 | 747 | 914 | -277 | -338 | -596 | -439 |
| 2012 | -345 | 0 | 36 | 390 | 659 | 646 | 829 | 694 | -447 | -559 | -248 | -220 |
| 2013 | -37 | -108 | -22 | 449 | 654 | 671 | 621 | 588 | -333 | -535 | -520 | -327 |
| 2014 | -212 | -170 | -233 | 423 | 688 | 757 | 798 | 727 | -470 | -532 | -573 | -273 |
| 2015 | -168 | -130 | -107 | 398 | 569 | 637 | 507 | 404 | -60 | -152 | -250 | -800 |
| 2016 | -609 | -698 | -517 | 286 | 589 | 449 | 357 | 561 | -429 | -380 | -811 | -906 |
| 2017 | -769 | -640 | -255 | 407 | 652 | 597 | 526 | 447 | -748 | -730 | -717 | -851 |
| 2018 | -266 | -223 | -89 | 332 | 581 | 597 | 593 | 546 | -150 | -279 | -209 | -326 |
| 2019 | -464 | -195 | -164 | 420 | 715 | 397 | 482 | 284 | -16 | -263 | -433 | -509 |
| 2020 | -340 | -270 | -76 | 60 | 230 | 207 | 205 | 134 | -342 | -436 | -651 | -414 |
| 2021 | -539 | -390 | -432 | 247 | 203 | 320 | 293 | 259 | -327 | -444 | -633 | -557 |
| 2022 | -- | -- | -- | -- | -- | -- | -- | -- | -- | -- | -- | -- |
| 2023 | -- | -- | -- | -- | -- | -- | -- | -- | -- | -- | -- | -- |
| 2024 | -- | |||||||||||
| - = No Data Reported; -- = Not Applicable; NA = Not Available; W = Withheld to avoid disclosure of individual company data. |
| Release Date: 3/29/2024 |
| Next Release Date: 4/30/2024 |