|
Download Data (XLS File) |
|
||||||||
|
||||||||
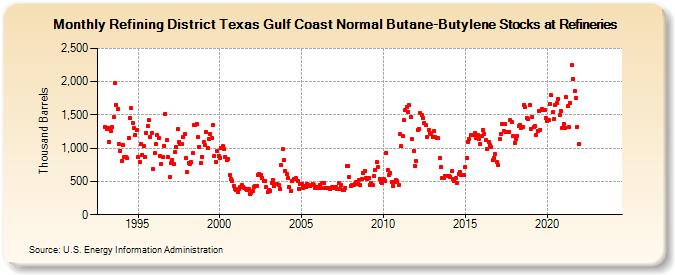
| Refining District Texas Gulf Coast Normal Butane-Butylene Stocks at Refineries (Thousand Barrels) | ||||||||
| Year | Jan | Feb | Mar | Apr | May | Jun | Jul | Aug | Sep | Oct | Nov | Dec |
|---|---|---|---|---|---|---|---|---|---|---|---|---|
| 1993 | 1,313 | 1,292 | 1,303 | 1,094 | 1,261 | 1,311 | 1,464 | 1,986 | 1,656 | 1,586 | 1,059 | 955 |
| 1994 | 812 | 1,042 | 872 | 861 | 845 | 1,150 | 1,457 | 1,599 | 1,382 | 1,302 | 1,205 | 1,280 |
| 1995 | 863 | 788 | 1,058 | 902 | 1,026 | 866 | 1,231 | 1,340 | 1,419 | 1,169 | 1,233 | 687 |
| 1996 | 922 | 1,064 | 1,201 | 1,152 | 881 | 763 | 867 | 1,036 | 1,521 | 1,119 | 864 | 566 |
| 1997 | 776 | 823 | 767 | 937 | 1,022 | 1,287 | 1,100 | 1,061 | 1,058 | 1,163 | 1,212 | 845 |
| 1998 | 637 | 778 | 769 | 789 | 926 | 1,341 | 1,350 | 1,365 | 1,167 | 1,025 | 780 | 875 |
| 1999 | 1,092 | 1,045 | 1,244 | 999 | 1,145 | 1,211 | 1,151 | 1,346 | 886 | 798 | 960 | 890 |
| 2000 | 859 | 1,007 | 1,026 | 985 | 868 | 829 | 834 | 591 | 533 | 514 | 438 | 391 |
| 2001 | 369 | 335 | 385 | 415 | 443 | 411 | 398 | 380 | 373 | 383 | 313 | 330 |
| 2002 | 362 | 419 | 430 | 432 | 601 | 616 | 603 | 558 | 506 | 507 | 417 | 334 |
| 2003 | 365 | 361 | 481 | 527 | 432 | 462 | 465 | 451 | 383 | 740 | 981 | 823 |
| 2004 | 659 | 610 | 551 | 412 | 355 | 501 | 538 | 542 | 549 | 500 | 392 | 465 |
| 2005 | 467 | 401 | 435 | 415 | 458 | 427 | 435 | 441 | 464 | 443 | 397 | 419 |
| 2006 | 408 | 448 | 409 | 483 | 483 | 395 | 400 | 406 | 406 | 381 | 412 | 400 |
| 2007 | 421 | 414 | 388 | 474 | 388 | 451 | 375 | 376 | 408 | 729 | 738 | 566 |
| 2008 | 431 | 440 | 443 | 457 | 491 | 466 | 525 | 449 | 531 | 627 | 651 | 553 |
| 2009 | 532 | 553 | 453 | 480 | 442 | 578 | 666 | 790 | 717 | 541 | 497 | 483 |
| 2010 | 536 | 504 | 932 | 671 | 603 | 631 | 494 | 437 | 493 | 528 | 506 | 449 |
| 2011 | 1,211 | 1,031 | 1,178 | 1,424 | 1,570 | 1,620 | 1,549 | 1,643 | 1,468 | 1,138 | 959 | 739 |
| 2012 | 810 | 1,277 | 1,295 | 1,532 | 1,501 | 1,461 | 1,380 | 1,346 | 1,166 | 1,278 | 1,224 | 1,206 |
| 2013 | 1,162 | 1,259 | 1,170 | 1,160 | 1,153 | 851 | 712 | 547 | 556 | 575 | 587 | 580 |
| 2014 | 580 | 572 | 651 | 543 | 504 | 553 | 476 | 619 | 649 | 597 | 601 | 592 |
| 2015 | 721 | 854 | 1,093 | 1,135 | 1,196 | 1,194 | 1,199 | 1,225 | 1,156 | 1,194 | 1,133 | 1,067 |
| 2016 | 1,185 | 1,270 | 1,218 | 1,118 | 992 | 1,086 | 1,051 | 1,012 | 817 | 856 | 906 | 799 |
| 2017 | 754 | 1,135 | 1,206 | 1,360 | 1,254 | 1,364 | 1,249 | 1,238 | 1,247 | 1,421 | 1,393 | 1,181 |
| 2018 | 1,082 | 1,138 | 1,182 | 1,329 | 1,353 | 1,305 | 1,323 | 1,654 | 1,614 | 1,453 | 1,446 | 1,643 |
| 2019 | 1,295 | 1,462 | 1,311 | 1,334 | 1,204 | 1,260 | 1,555 | 1,278 | 1,589 | 1,579 | 1,570 | 1,454 |
| 2020 | 1,415 | 1,431 | 1,665 | 1,792 | 1,538 | 1,432 | 1,646 | 1,675 | 1,739 | 1,494 | 1,566 | 1,303 |
| 2021 | 1,361 | 1,300 | 1,762 | 1,630 | 1,318 | 1,684 | 2,251 | 2,037 | 1,855 | 1,755 | 1,325 | 1,062 |
| 2022 | -- | -- | -- | -- | -- | -- | -- | -- | -- | -- | -- | -- |
| 2023 | -- | -- | -- | -- | -- | -- | -- | -- | -- | -- | -- | -- |
| 2024 | -- | |||||||||||
| - = No Data Reported; -- = Not Applicable; NA = Not Available; W = Withheld to avoid disclosure of individual company data. |
| Release Date: 3/29/2024 |
| Next Release Date: 4/30/2024 |