|
Download Data (XLS File) |
|
||||||||
|
||||||||
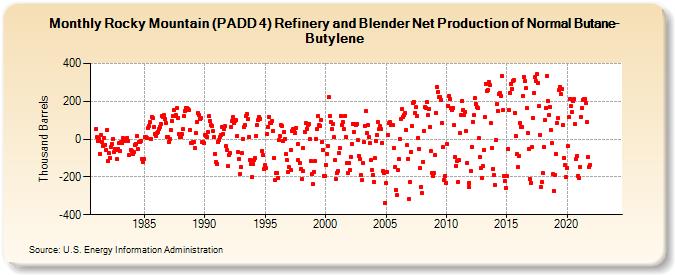
| Rocky Mountain (PADD 4) Refinery and Blender Net Production of Normal Butane-Butylene (Thousand Barrels) | ||||||||
| Year | Jan | Feb | Mar | Apr | May | Jun | Jul | Aug | Sep | Oct | Nov | Dec |
|---|---|---|---|---|---|---|---|---|---|---|---|---|
| 1981 | 56 | 9 | -10 | -1 | -80 | 23 | -15 | -39 | 7 | -29 | -57 | 49 |
| 1982 | -115 | -75 | -100 | -40 | -24 | -1 | -68 | -55 | -57 | -107 | -52 | -18 |
| 1983 | -63 | -14 | -23 | 4 | 3 | -9 | -1 | 8 | -8 | -83 | -56 | -64 |
| 1984 | -80 | -68 | -29 | -24 | 17 | -52 | -17 | -17 | -8 | -105 | -120 | -104 |
| 1985 | 13 | 10 | 5 | 58 | 70 | 88 | 0 | 117 | 110 | 62 | 27 | 17 |
| 1986 | 31 | 37 | 52 | 66 | 81 | 124 | 119 | 127 | 107 | 86 | 12 | 10 |
| 1987 | -14 | 2 | 50 | 98 | 121 | 152 | 123 | 130 | 162 | 114 | 26 | 11 |
| 1988 | 11 | 26 | 52 | 121 | 149 | 166 | 163 | 161 | 152 | 50 | -22 | -20 |
| 1989 | -16 | -15 | -46 | 30 | 91 | 137 | 125 | 106 | 114 | -16 | -16 | -21 |
| 1990 | 23 | 17 | 12 | 37 | 120 | 96 | 72 | 69 | 45 | 10 | -78 | -120 |
| 1991 | -130 | -15 | -5 | 12 | 22 | 63 | 29 | 56 | 67 | -39 | -60 | -144 |
| 1992 | -84 | -75 | 66 | 97 | 115 | 83 | 95 | 99 | 19 | -69 | -103 | -183 |
| 1993 | -150 | -75 | 3 | 62 | 74 | 124 | 133 | 107 | 13 | -108 | -134 | -202 |
| 1994 | -133 | -109 | -101 | 17 | 72 | 100 | 119 | 108 | -64 | -86 | -156 | |
| 1995 | -138 | -152 | 26 | 64 | 118 | 83 | 87 | 96 | 45 | -99 | -218 | -180 |
| 1996 | -180 | -207 | -6 | 15 | 72 | 69 | -8 | 39 | 3 | -79 | -112 | -176 |
| 1997 | -149 | -164 | -56 | 45 | 55 | 51 | 34 | 58 | -28 | -111 | -129 | -156 |
| 1998 | -209 | -167 | -48 | 40 | 83 | 54 | 72 | 81 | 0 | -117 | -185 | -237 |
| 1999 | -173 | -117 | 3 | 52 | 121 | 73 | 71 | 100 | -17 | -56 | -194 | -197 |
| 2000 | -136 | -78 | -34 | 221 | 121 | 89 | 54 | 81 | 9 | -112 | -213 | -179 |
| 2001 | -169 | -74 | -48 | 122 | 75 | 91 | 51 | 123 | 12 | -126 | -181 | -128 |
| 2002 | -161 | -94 | -27 | 82 | 37 | 82 | 74 | 79 | -5 | -87 | -104 | -189 |
| 2003 | -219 | -128 | -17 | 70 | 148 | 31 | 72 | 12 | -23 | -112 | -161 | -189 |
| 2004 | -225 | -100 | -9 | 21 | 89 | 53 | 69 | 51 | -18 | -168 | -180 | -338 |
| 2005 | -234 | -174 | 22 | 86 | 90 | 75 | 77 | 73 | -47 | -147 | -270 | -296 |
| 2006 | -163 | -107 | -2 | 107 | 160 | 118 | 130 | 139 | 50 | -33 | -103 | -315 |
| 2007 | -228 | -66 | 71 | 192 | 198 | 139 | 168 | 122 | 7 | -52 | -153 | -253 |
| 2008 | -287 | -119 | 44 | 170 | 162 | 195 | 127 | 157 | 63 | -65 | -177 | -193 |
| 2009 | -177 | -83 | 140 | 273 | 250 | 223 | 221 | 206 | 87 | -43 | -216 | -196 |
| 2010 | -230 | -26 | 177 | 229 | 212 | 167 | 154 | 164 | 72 | -96 | -141 | -114 |
| 2011 | -225 | -111 | 30 | 129 | 202 | 155 | 130 | 144 | 41 | -124 | -254 | -232 |
| 2012 | -169 | -43 | 92 | 125 | 216 | 187 | 170 | 166 | 4 | -95 | -153 | -206 |
| 2013 | -141 | -59 | 116 | 294 | 254 | 259 | 303 | 288 | 83 | -45 | -157 | -190 |
| 2014 | -241 | -6 | 185 | 148 | 238 | 243 | 226 | 335 | 152 | -197 | -221 | -258 |
| 2015 | -196 | -52 | 154 | 245 | 291 | 266 | 308 | 312 | 140 | 17 | -79 | -148 |
| 2016 | -88 | 85 | 66 | 66 | 228 | 331 | 307 | 268 | 162 | 34 | -54 | -211 |
| 2017 | -232 | -43 | 114 | 245 | 326 | 305 | 343 | 297 | 173 | 23 | -252 | -226 |
| 2018 | -181 | -44 | 102 | 165 | 334 | 201 | 129 | 172 | 48 | -22 | -186 | -273 |
| 2019 | -191 | -77 | 86 | 110 | 258 | 278 | 236 | 264 | 74 | -98 | -139 | -201 |
| 2020 | -153 | -38 | 115 | 213 | 173 | 144 | 201 | 212 | 78 | -107 | -90 | -193 |
| 2021 | -206 | -146 | 117 | 164 | 209 | 210 | 213 | 189 | 88 | -96 | -145 | -138 |
| 2022 | -- | -- | -- | -- | -- | -- | -- | -- | -- | -- | -- | -- |
| 2023 | -- | -- | -- | -- | -- | -- | -- | -- | -- | -- | -- | -- |
| 2024 | -- | |||||||||||
| - = No Data Reported; -- = Not Applicable; NA = Not Available; W = Withheld to avoid disclosure of individual company data. |
| Release Date: 3/29/2024 |
| Next Release Date: 4/30/2024 |