|
Download Data (XLS File) |
|
||||||||
|
||||||||
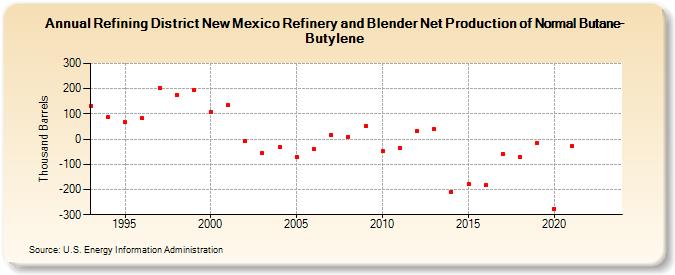
| Refining District New Mexico Refinery and Blender Net Production of Normal Butane-Butylene (Thousand Barrels) | ||||||||
| Decade | Year-0 | Year-1 | Year-2 | Year-3 | Year-4 | Year-5 | Year-6 | Year-7 | Year-8 | Year-9 |
|---|---|---|---|---|---|---|---|---|---|---|
| 1990's | 133 | 86 | 66 | 82 | 202 | 175 | 195 | |||
| 2000's | 107 | 135 | -7 | -57 | -33 | -70 | -40 | 18 | 10 | 51 |
| 2010's | -49 | -35 | 31 | 39 | -208 | -180 | -182 | -59 | -70 | -17 |
| 2020's | -276 | -29 | -- | -- |
| - = No Data Reported; -- = Not Applicable; NA = Not Available; W = Withheld to avoid disclosure of individual company data. |
| Release Date: 3/29/2024 |
| Next Release Date: 8/30/2024 |