|
Download Data (XLS File) |
|
||||||||
|
||||||||
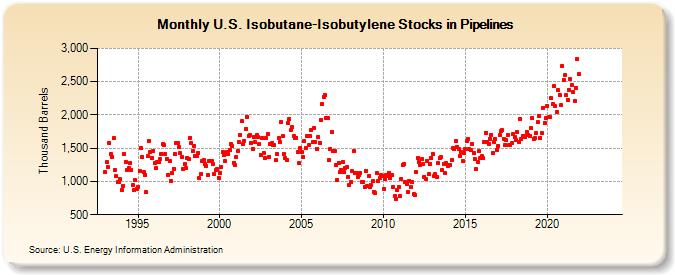
| U.S. Isobutane-Isobutylene Stocks in Pipelines (Thousand Barrels) | ||||||||
| Year | Jan | Feb | Mar | Apr | May | Jun | Jul | Aug | Sep | Oct | Nov | Dec |
|---|---|---|---|---|---|---|---|---|---|---|---|---|
| 1993 | 1,137 | 1,287 | 1,215 | 1,585 | 1,407 | 1,373 | 1,654 | 1,178 | 1,078 | 994 | 988 | 1,031 |
| 1994 | 869 | 933 | 1,413 | 1,295 | 1,174 | 1,199 | 1,272 | 1,168 | 947 | 872 | 1,018 | 890 |
| 1995 | 921 | 1,163 | 1,508 | 1,373 | 1,144 | 1,101 | 834 | 1,376 | 1,611 | 1,439 | 1,354 | 1,458 |
| 1996 | 1,271 | 1,195 | 1,287 | 1,289 | 1,332 | 1,410 | 1,561 | 1,553 | 1,414 | 1,341 | 1,099 | 1,309 |
| 1997 | 1,012 | 1,120 | 1,193 | 1,420 | 1,571 | 1,580 | 1,518 | 1,422 | 1,367 | 1,191 | 1,259 | 1,205 |
| 1998 | 1,356 | 1,340 | 1,660 | 1,579 | 1,458 | 1,537 | 1,384 | 1,377 | 1,428 | 1,048 | 1,110 | 1,313 |
| 1999 | 1,320 | 1,266 | 1,235 | 1,095 | 1,310 | 1,307 | 1,306 | 1,266 | 1,110 | 1,166 | 1,180 | 1,056 |
| 2000 | 1,132 | 1,219 | 1,439 | 1,393 | 1,300 | 1,439 | 1,407 | 1,475 | 1,559 | 1,528 | 1,284 | 1,247 |
| 2001 | 1,360 | 1,459 | 1,589 | 1,704 | 1,903 | 1,564 | 1,614 | 1,790 | 1,966 | 1,689 | 1,702 | 1,585 |
| 2002 | 1,492 | 1,663 | 1,588 | 1,693 | 1,667 | 1,560 | 1,394 | 1,657 | 1,429 | 1,356 | 1,649 | 1,710 |
| 2003 | 1,375 | 1,564 | 1,576 | 1,549 | 1,547 | 1,315 | 1,413 | 1,652 | 1,592 | 1,893 | 1,687 | 1,414 |
| 2004 | 1,352 | 1,324 | 1,885 | 1,942 | 1,767 | 1,820 | 1,685 | 1,656 | 1,657 | 1,442 | 1,270 | 1,507 |
| 2005 | 1,444 | 1,360 | 1,604 | 1,503 | 1,681 | 1,542 | 1,686 | 1,778 | 1,588 | 1,807 | 1,600 | 1,493 |
| 2006 | 1,675 | 1,584 | 1,928 | 2,169 | 2,266 | 2,303 | 1,959 | 1,949 | 1,319 | 1,490 | 1,742 | 1,464 |
| 2007 | 1,461 | 1,247 | 1,029 | 1,284 | 1,145 | 1,176 | 1,293 | 1,143 | 1,206 | 1,212 | 1,072 | 953 |
| 2008 | 991 | 1,151 | 1,459 | 1,122 | 1,134 | 1,072 | 1,102 | 1,124 | 995 | 994 | 919 | 1,161 |
| 2009 | 930 | 1,081 | 911 | 942 | 1,001 | 846 | 827 | 1,126 | 1,014 | 1,048 | 1,091 | 1,082 |
| 2010 | 883 | 1,037 | 1,092 | 1,084 | 1,131 | 1,054 | 1,103 | 921 | 783 | 737 | 876 | 915 |
| 2011 | 779 | 1,037 | 1,249 | 1,265 | 989 | 969 | 847 | 1,003 | 916 | 993 | 804 | 789 |
| 2012 | 1,140 | 1,353 | 1,289 | 1,251 | 1,337 | 1,261 | 1,070 | 1,038 | 1,314 | 1,107 | 1,268 | 1,357 |
| 2013 | 1,416 | 1,075 | 1,106 | 1,065 | 1,274 | 1,355 | 1,363 | 1,166 | 1,266 | 1,126 | 1,279 | 1,237 |
| 2014 | 1,250 | 1,250 | 1,321 | 1,504 | 1,489 | 1,613 | 1,515 | 1,482 | 1,379 | 1,443 | 1,306 | 1,426 |
| 2015 | 1,487 | 1,604 | 1,639 | 1,484 | 1,475 | 1,570 | 1,429 | 1,333 | 1,180 | 1,291 | 1,456 | 1,348 |
| 2016 | 1,385 | 1,347 | 1,598 | 1,732 | 1,600 | 1,566 | 1,644 | 1,703 | 1,421 | 1,588 | 1,635 | 1,469 |
| 2017 | 1,538 | 1,692 | 1,752 | 1,767 | 1,645 | 1,551 | 1,621 | 1,696 | 1,553 | 1,551 | 1,573 | 1,707 |
| 2018 | 1,661 | 1,620 | 1,745 | 1,591 | 1,936 | 1,635 | 1,687 | 1,680 | 1,674 | 1,740 | 1,700 | 1,676 |
| 2019 | 1,797 | 1,951 | 1,639 | 1,646 | 1,726 | 1,887 | 1,984 | 1,660 | 1,722 | 2,110 | 1,875 | 1,950 |
| 2020 | 2,139 | 1,966 | 1,976 | 2,253 | 2,163 | 2,431 | 2,134 | 2,044 | 2,369 | 2,300 | 2,145 | 2,738 |
| 2021 | 2,529 | 2,600 | 2,294 | 2,229 | 2,378 | 2,533 | 2,447 | 2,338 | 2,204 | 2,405 | 2,839 | 2,609 |
| 2022 | -- | -- | -- | -- | -- | -- | -- | -- | -- | -- | -- | -- |
| 2023 | -- | -- | -- | -- | -- | -- | -- | -- | -- | -- | -- | -- |
| 2024 | -- | |||||||||||
| - = No Data Reported; -- = Not Applicable; NA = Not Available; W = Withheld to avoid disclosure of individual company data. |
| Release Date: 3/29/2024 |
| Next Release Date: 4/30/2024 |