|
Download Data (XLS File) |
|
||||||||
|
||||||||
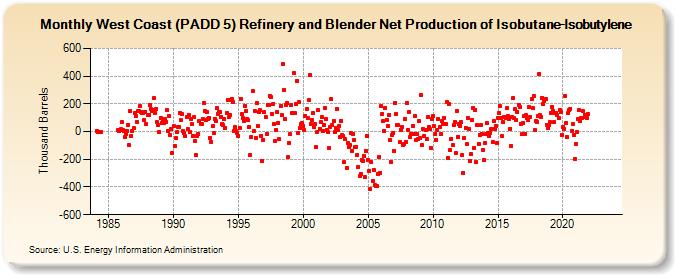
| West Coast (PADD 5) Refinery and Blender Net Production of Isobutane-Isobutylene (Thousand Barrels) | ||||||||
| Year | Jan | Feb | Mar | Apr | May | Jun | Jul | Aug | Sep | Oct | Nov | Dec |
|---|---|---|---|---|---|---|---|---|---|---|---|---|
| 1984 | 3 | -4 | -3 | -3 | -1 | |||||||
| 1985 | 9 | 3 | 16 | |||||||||
| 1986 | 68 | 11 | 3 | -40 | -16 | 1 | 50 | -97 | 148 | -29 | 7 | 24 |
| 1987 | 136 | 111 | 70 | 146 | 145 | 186 | 144 | 134 | 134 | 83 | 143 | 56 |
| 1988 | 120 | 118 | 191 | 164 | 149 | 158 | 241 | 135 | 164 | 66 | 46 | 0 |
| 1989 | 97 | 65 | 78 | 60 | 87 | 71 | 155 | 5 | 112 | -28 | 15 | -154 |
| 1990 | 38 | -104 | -46 | -6 | 34 | 36 | 137 | 80 | 128 | 4 | -12 | -35 |
| 1991 | 107 | 17 | 123 | -5 | 90 | 52 | -29 | 104 | -70 | -168 | -29 | -16 |
| 1992 | 77 | 56 | 53 | 94 | 205 | 150 | 86 | 138 | 92 | 100 | -43 | -74 |
| 1993 | 39 | -11 | 94 | 74 | 168 | 128 | 143 | 141 | 105 | 57 | 47 | 87 |
| 1994 | 24 | 133 | 225 | 104 | 120 | 226 | 237 | 212 | 5 | 31 | 2 | -7 |
| 1995 | -32 | 27 | 237 | 126 | 97 | 76 | 181 | 147 | 92 | 80 | 32 | -167 |
| 1996 | -41 | 293 | 1 | 151 | -44 | 207 | 42 | 141 | 154 | -30 | -212 | -60 |
| 1997 | 140 | 108 | -18 | 191 | 195 | 259 | 250 | 127 | 201 | 53 | -69 | 8 |
| 1998 | 140 | 65 | -55 | 183 | 116 | 485 | 298 | 91 | 190 | 208 | -184 | -82 |
| 1999 | -21 | 192 | 132 | 420 | 131 | 197 | 368 | -10 | 212 | 24 | 53 | 60 |
| 2000 | 43 | 12 | 115 | 164 | 95 | 227 | 409 | 51 | 85 | 132 | 32 | 55 |
| 2001 | -111 | 0 | 154 | 21 | 67 | 103 | 2 | 45 | 170 | 88 | 11 | -5 |
| 2002 | -119 | 33 | 236 | 47 | 77 | -2 | 28 | 163 | 9 | 39 | -40 | 79 |
| 2003 | -28 | -34 | -221 | -57 | -261 | -83 | -113 | -97 | -11 | -137 | -18 | -60 |
| 2004 | -110 | -109 | -172 | -253 | -323 | -304 | -203 | -212 | -175 | -330 | -137 | -30 |
| 2005 | -203 | -281 | -414 | -220 | -356 | -280 | -387 | -390 | -390 | -309 | -182 | -296 |
| 2006 | 181 | 129 | 73 | 4 | 169 | 84 | 40 | 119 | -60 | -220 | -26 | -8 |
| 2007 | -137 | 207 | 124 | 50 | 44 | -77 | 13 | 33 | -96 | -88 | 94 | -72 |
| 2008 | 204 | 12 | 144 | -42 | -19 | 39 | -18 | 112 | -61 | -18 | -54 | 76 |
| 2009 | -50 | 266 | -98 | 17 | -29 | 10 | -57 | 105 | 35 | 16 | -116 | 88 |
| 2010 | 110 | 40 | -19 | -59 | 14 | 92 | 33 | -19 | 75 | 54 | 101 | 55 |
| 2011 | 53 | 213 | -194 | 202 | -136 | -51 | -98 | 44 | 71 | -154 | 151 | -36 |
| 2012 | 51 | 43 | 67 | -167 | -298 | -43 | 28 | -92 | 97 | 21 | -211 | -163 |
| 2013 | 83 | 172 | -116 | 159 | -222 | 44 | -89 | -24 | 44 | -15 | -131 | -204 |
| 2014 | -84 | -18 | 59 | -10 | -32 | -9 | 21 | -72 | 74 | 21 | 43 | -86 |
| 2015 | 99 | 133 | 182 | 99 | -34 | 68 | 107 | 100 | 167 | 112 | 94 | 21 |
| 2016 | -101 | 104 | 240 | 97 | 162 | 82 | 141 | 195 | 179 | 57 | -21 | 65 |
| 2017 | 109 | -15 | 118 | 98 | 83 | 177 | 104 | 238 | 168 | 255 | 11 | 79 |
| 2018 | 72 | 109 | 414 | 117 | 105 | 245 | 199 | 222 | 235 | 49 | 27 | 44 |
| 2019 | 69 | 134 | 179 | 151 | 68 | 131 | 131 | 119 | 97 | 154 | 144 | -22 |
| 2020 | 34 | 15 | 257 | 64 | -38 | 131 | 152 | 165 | 6 | 52 | -26 | -195 |
| 2021 | -89 | -3 | 87 | 153 | 79 | 95 | 100 | 145 | 120 | 105 | 99 | 129 |
| 2022 | -- | -- | -- | -- | -- | -- | -- | -- | -- | -- | -- | -- |
| 2023 | -- | -- | -- | -- | -- | -- | -- | -- | -- | -- | -- | -- |
| 2024 | -- | |||||||||||
| - = No Data Reported; -- = Not Applicable; NA = Not Available; W = Withheld to avoid disclosure of individual company data. |
| Release Date: 3/29/2024 |
| Next Release Date: 4/30/2024 |