|
Download Data (XLS File) |
|
||||||||
|
||||||||
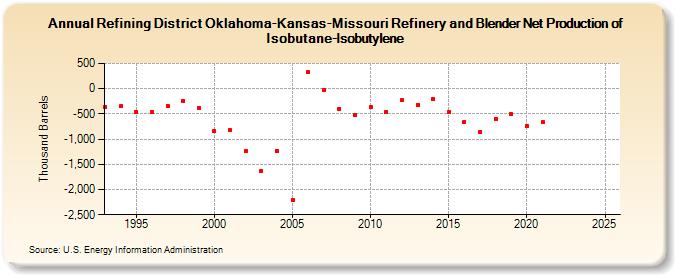
| Refining District Oklahoma-Kansas-Missouri Refinery and Blender Net Production of Isobutane-Isobutylene (Thousand Barrels) | ||||||||
| Decade | Year-0 | Year-1 | Year-2 | Year-3 | Year-4 | Year-5 | Year-6 | Year-7 | Year-8 | Year-9 |
|---|---|---|---|---|---|---|---|---|---|---|
| 1990's | -369 | -352 | -456 | -469 | -338 | -252 | -381 | |||
| 2000's | -841 | -823 | -1,237 | -1,626 | -1,239 | -2,205 | 326 | -25 | -398 | -521 |
| 2010's | -361 | -457 | -231 | -314 | -211 | -454 | -658 | -859 | -600 | -507 |
| 2020's | -749 | -669 | -- | -- |
| - = No Data Reported; -- = Not Applicable; NA = Not Available; W = Withheld to avoid disclosure of individual company data. |
| Release Date: 3/29/2024 |
| Next Release Date: 8/30/2024 |