|
Download Data (XLS File) |
|
||||||||
|
||||||||
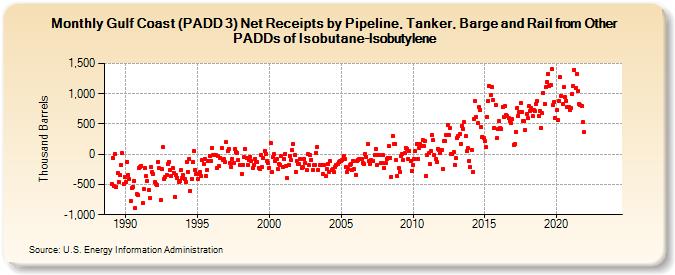
| Gulf Coast (PADD 3) Net Receipts by Pipeline, Tanker, Barge and Rail from Other PADDs of Isobutane-Isobutylene (Thousand Barrels) | ||||||||
| Year | Jan | Feb | Mar | Apr | May | Jun | Jul | Aug | Sep | Oct | Nov | Dec |
|---|---|---|---|---|---|---|---|---|---|---|---|---|
| 1989 | -499 | -63 | -528 | 11 | -536 | -311 | -456 | -344 | -172 | 15 | -491 | -370 |
| 1990 | -461 | -126 | -338 | -415 | -768 | -556 | -537 | -439 | -886 | -660 | -679 | -230 |
| 1991 | -207 | -194 | -814 | -579 | -225 | -362 | -435 | -591 | -722 | -205 | -298 | -328 |
| 1992 | -466 | -496 | -514 | -123 | -232 | -757 | -250 | 112 | -416 | -377 | -340 | -164 |
| 1993 | -121 | -256 | -356 | -221 | -305 | -699 | -345 | -386 | -454 | -437 | -264 | -390 |
| 1994 | -342 | -416 | -463 | -123 | -290 | -75 | -605 | -403 | -132 | 48 | -267 | -326 |
| 1995 | -416 | -329 | -293 | -357 | -93 | -160 | -75 | -358 | -259 | -110 | -24 | -114 |
| 1996 | 106 | -10 | -20 | -15 | -229 | -29 | -196 | -55 | 106 | -103 | -82 | -133 |
| 1997 | 195 | 55 | 93 | -145 | -217 | -72 | -143 | 88 | 33 | 27 | -95 | -177 |
| 1998 | -178 | -321 | -170 | -46 | 93 | -69 | -173 | -100 | -38 | -119 | -235 | -180 |
| 1999 | -72 | -134 | -132 | -226 | -240 | -21 | -215 | -60 | 60 | 6 | -108 | -137 |
| 2000 | -223 | 179 | -292 | -48 | 2 | -105 | -87 | -251 | -165 | -172 | -35 | -210 |
| 2001 | -76 | 6 | -188 | -397 | -171 | -29 | -99 | 68 | 172 | -10 | -297 | -111 |
| 2002 | -165 | -164 | -74 | -230 | -216 | -82 | -137 | -265 | -4 | -185 | -18 | -90 |
| 2003 | -259 | -186 | -172 | 26 | 120 | -259 | -177 | -182 | -183 | -323 | -173 | -365 |
| 2004 | -242 | -159 | -290 | -120 | -254 | -239 | -286 | -208 | -175 | -164 | -135 | -114 |
| 2005 | -107 | -99 | -30 | -74 | -215 | -290 | -248 | -179 | -163 | -264 | -111 | -251 |
| 2006 | -347 | -118 | -88 | -86 | -79 | -74 | -143 | -167 | 0 | -38 | 162 | -117 |
| 2007 | -165 | -94 | -109 | -115 | -20 | 83 | -174 | -19 | -12 | -152 | -144 | -21 |
| 2008 | -221 | -153 | -75 | -62 | 129 | -62 | -369 | 302 | 161 | 177 | -102 | -367 |
| 2009 | -232 | -286 | -34 | -2 | -92 | 20 | 106 | 94 | -76 | 59 | -107 | -274 |
| 2010 | -172 | -71 | 48 | 173 | -80 | 99 | 170 | 137 | 240 | 130 | 217 | -353 |
| 2011 | -10 | 12 | -165 | 57 | 315 | 228 | -14 | -81 | -127 | 88 | 64 | 17 |
| 2012 | 75 | -244 | 219 | 213 | 321 | 483 | 323 | 437 | 11 | 3 | 36 | -174 |
| 2013 | -69 | 269 | 297 | 342 | 177 | 467 | 418 | 526 | 299 | 45 | 98 | -110 |
| 2014 | -218 | 71 | -294 | 576 | 873 | 612 | 510 | 779 | 739 | 448 | 291 | 262 |
| 2015 | 224 | 115 | 618 | 885 | 1,130 | 972 | 1,105 | 903 | 439 | 818 | 268 | 422 |
| 2016 | 542 | 439 | 420 | 787 | 622 | 789 | 645 | 634 | 594 | 554 | 518 | 575 |
| 2017 | 158 | 174 | 372 | 770 | 638 | 696 | 847 | 698 | 544 | 541 | 403 | 657 |
| 2018 | 592 | 790 | 713 | 766 | 631 | 728 | 710 | 835 | 873 | 632 | 714 | 439 |
| 2019 | 681 | 1,010 | 838 | 1,105 | 1,202 | 1,334 | 1,125 | 1,147 | 1,408 | 811 | 869 | 607 |
| 2020 | 730 | 558 | 885 | 1,275 | 965 | 827 | 1,104 | 939 | 885 | 787 | 785 | 738 |
| 2021 | 758 | 1,003 | 1,128 | 1,398 | 1,094 | 1,331 | 1,040 | 822 | 808 | 803 | 528 | 363 |
| 2022 | -- | -- | -- | -- | -- | -- | -- | -- | -- | -- | -- | -- |
| 2023 | -- | -- | -- | -- | -- | -- | -- | -- | -- | -- | -- | -- |
| 2024 | -- | |||||||||||
| - = No Data Reported; -- = Not Applicable; NA = Not Available; W = Withheld to avoid disclosure of individual company data. |
| Release Date: 3/29/2024 |
| Next Release Date: 4/30/2024 |
Referring Pages: