|
Download Data (XLS File) |
|
||||||||
|
||||||||
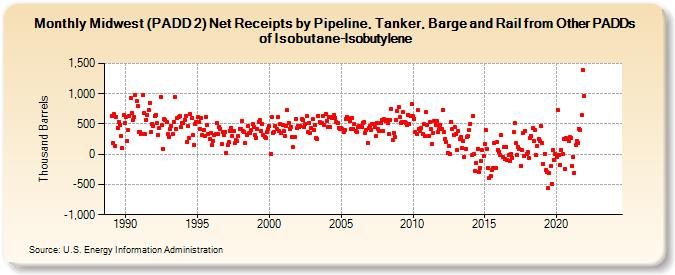
| Midwest (PADD 2) Net Receipts by Pipeline, Tanker, Barge and Rail from Other PADDs of Isobutane-Isobutylene (Thousand Barrels) | ||||||||
| Year | Jan | Feb | Mar | Apr | May | Jun | Jul | Aug | Sep | Oct | Nov | Dec |
|---|---|---|---|---|---|---|---|---|---|---|---|---|
| 1989 | 628 | 178 | 662 | 132 | 621 | 438 | 529 | 484 | 299 | 100 | 644 | 522 |
| 1990 | 609 | 221 | 404 | 626 | 933 | 685 | 565 | 615 | 986 | 881 | 798 | 365 |
| 1991 | 366 | 341 | 975 | 685 | 335 | 570 | 649 | 736 | 852 | 365 | 501 | 473 |
| 1992 | 638 | 648 | 514 | 324 | 439 | 946 | 476 | 90 | 586 | 567 | 531 | 334 |
| 1993 | 291 | 419 | 464 | 328 | 539 | 947 | 425 | 607 | 623 | 629 | 442 | 523 |
| 1994 | 511 | 570 | 637 | 203 | 472 | 270 | 662 | 595 | 319 | 151 | 492 | 526 |
| 1995 | 616 | 526 | 421 | 593 | 318 | 394 | 303 | 618 | 485 | 337 | 254 | 349 |
| 1996 | 149 | 221 | 314 | 331 | 509 | 327 | 453 | 425 | 164 | 374 | 319 | 374 |
| 1997 | 24 | 149 | 195 | 384 | 438 | 304 | 389 | 188 | 234 | 216 | 300 | 425 |
| 1998 | 422 | 550 | 382 | 375 | 180 | 318 | 459 | 350 | 345 | 408 | 495 | 444 |
| 1999 | 321 | 271 | 425 | 534 | 564 | 389 | 502 | 323 | 281 | 268 | 364 | 418 |
| 2000 | 461 | 11 | 618 | 358 | 373 | 460 | 412 | 616 | 383 | 506 | 351 | 479 |
| 2001 | 380 | 298 | 467 | 727 | 522 | 420 | 455 | 288 | 119 | 279 | 583 | 428 |
| 2002 | 470 | 442 | 472 | 578 | 566 | 451 | 493 | 627 | 367 | 522 | 350 | 433 |
| 2003 | 575 | 400 | 479 | 276 | 258 | 636 | 539 | 518 | 521 | 628 | 475 | 672 |
| 2004 | 553 | 449 | 622 | 444 | 595 | 621 | 653 | 597 | 525 | 516 | 436 | 414 |
| 2005 | 430 | 415 | 371 | 396 | 587 | 610 | 595 | 557 | 416 | 599 | 424 | 500 |
| 2006 | 385 | 364 | 443 | 473 | 452 | 445 | 514 | 525 | 356 | 398 | 179 | 431 |
| 2007 | 472 | 402 | 495 | 506 | 446 | 304 | 520 | 409 | 383 | 520 | 567 | 387 |
| 2008 | 576 | 542 | 570 | 524 | 341 | 559 | 745 | 229 | 349 | 287 | 566 | 714 |
| 2009 | 787 | 618 | 510 | 533 | 697 | 535 | 511 | 484 | 654 | 502 | 625 | 822 |
| 2010 | 627 | 587 | 370 | 342 | 723 | 423 | 392 | 434 | 340 | 497 | 307 | 690 |
| 2011 | 476 | 305 | 531 | 418 | 172 | 354 | 542 | 483 | 546 | 370 | 425 | 490 |
| 2012 | 418 | 738 | 363 | 252 | 203 | 27 | 140 | 6 | 540 | 417 | 320 | 445 |
| 2013 | 328 | 71 | 386 | 253 | 284 | 109 | 226 | -43 | 93 | 291 | 297 | 404 |
| 2014 | 507 | -18 | 624 | 3 | -280 | -144 | 92 | -290 | -224 | -120 | 65 | -30 |
| 2015 | 172 | 397 | 90 | -222 | -400 | -356 | -267 | -227 | 186 | -226 | 196 | 73 |
| 2016 | 44 | -9 | 318 | -50 | 118 | -83 | 112 | -92 | -21 | -115 | 8 | -59 |
| 2017 | 362 | 524 | 179 | -20 | 122 | 86 | -193 | 63 | 344 | -33 | 389 | 6 |
| 2018 | 38 | -66 | 269 | 296 | 441 | 226 | 400 | -15 | 144 | 245 | 219 | 465 |
| 2019 | 185 | -155 | 11 | -268 | -290 | -562 | -313 | -193 | -488 | 63 | -94 | 2 |
| 2020 | -45 | 726 | -14 | -175 | 74 | -4 | 255 | -247 | 263 | 248 | 211 | 277 |
| 2021 | 271 | -195 | -46 | -310 | 150 | 223 | 182 | 424 | 400 | 643 | 1,389 | 956 |
| 2022 | -- | -- | -- | -- | -- | -- | -- | -- | -- | -- | -- | -- |
| 2023 | -- | -- | -- | -- | -- | -- | -- | -- | -- | -- | -- | -- |
| 2024 | -- | |||||||||||
| - = No Data Reported; -- = Not Applicable; NA = Not Available; W = Withheld to avoid disclosure of individual company data. |
| Release Date: 3/29/2024 |
| Next Release Date: 4/30/2024 |